



SUI hit a new yearly high of 1,539 TPS as the token traded near $0.91, with traders watching $0.90 support and $1 resistance.
SUI reached a new yearly high of 1,539 transactions per second today, while its token traded near $0.91.
The network activity marked a fresh throughput milestone, but the daily price chart showed that SUI remained under pressure.
Traders are now watching whether stronger network use can support a price recovery from the current support zone.

SUI Network Records New Yearly TPS High
SUI officially reached 1,539 TPS today, setting a new yearly high for network throughput. TPS measures how many transactions a blockchain can process each second.
BREAKING 🚨$SUI just officially hit a new yearly high of 1,539 TPS today! https://t.co/zkhpLDWjqP pic.twitter.com/qvUMwTauQ7
— Sui Community💧 (@Community_Sui) May 30, 2026
The latest reading showed increased activity on the SUI network. Higher throughput can reflect stronger network demand, though it does not always move token price directly.
The milestone came while SUI traded near $0.91 on the daily chart. This placed the token close to a short-term support range between $0.90 and $1.00.
Market analysts showed that price action remained weak despite the network update. SUI was still trading below major technical levels from its earlier rally.
SUI Price Trades Below Major Fibonacci Levels
SUI previously moved from a lower accumulation area near $1.26 to a cycle high near $3.80. The chart now shows that the token has retraced that full move.
The Fibonacci retracement levels on the chart include $1.80, $2.23, $2.53, $2.83, and $3.20. These levels now act as resistance zones if price begins to recover.
SUI is trading below the $1.26 retracement base. This level was once an important support area during the broader market structure.
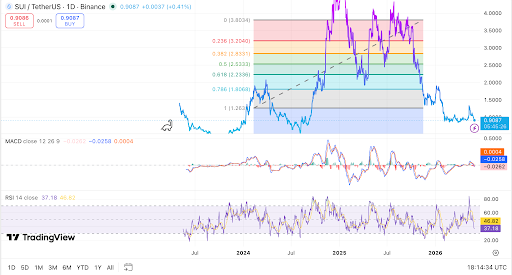
A move back above $1.26 would be watched by traders for stronger recovery signs. Until then, the chart shows continued weakness below former support.
The first near-term resistance sits between $1.00 and $1.10. A daily close above this area could show early buying interest.
Read Also:
Momentum Indicators Show Weak Market Control
The RSI on the daily chart is near 37. This shows weak momentum, although the token is not deeply oversold.
RSI would need to move above 50 to show stronger buyer control. Until that happens, any rebound may remain limited.
The MACD also remains weak on the daily timeframe. The MACD line is below the signal line, and the histogram is slightly negative.
This setup shows that sellers still have control. However, the current MACD reading does not show strong downside pressure.
SUI remains near a key support area. Holding the $0.90 zone may allow a short-term bounce toward $1.00.
A clean move below $0.90 could bring more selling pressure. In that case, traders may watch the $0.70 to $0.75 range.
The wider technical structure remains cautious while SUI trades below $1.26. Failed recovery attempts and lower highs continue to shape the chart.
The network’s 1,539 TPS milestone adds a separate data point for SUI activity. Price action, however, still depends on support holds, resistance flips, and market demand.



Be the first to comment