


What to know:
- SUI is holding near the $0.92 support level, showing a phase of low volatility and sideways consolidation.
- Short-term recovery is possible if buying pressure strengthens, with upside targets seen around $0.94–$0.96.
- Technical indicators remain weak, with RSI at 47.16 and price trading below key moving averages, keeping bearish pressure intact.

SUI is experiencing a slow consolidation period due to its weak performance. It seems that the SUI price is attempting to stabilize itself at the level of key support. In general, there has been no trend movement, and neither side has generated any momentum.
Should the current stability persist, there may be hope for a gradual recovery, contingent on whether buying pressure can be sustained long enough to drive an upward trend.
At the time of writing, the token is trading at $0.9225, with a 24-hour trading volume of $250.92 million and a market capitalization of $3.69 billion. Over the last 24 hours, the price has slipped slightly by 0.2%, reflecting a largely flat market with minimal movement and subdued trading activity.

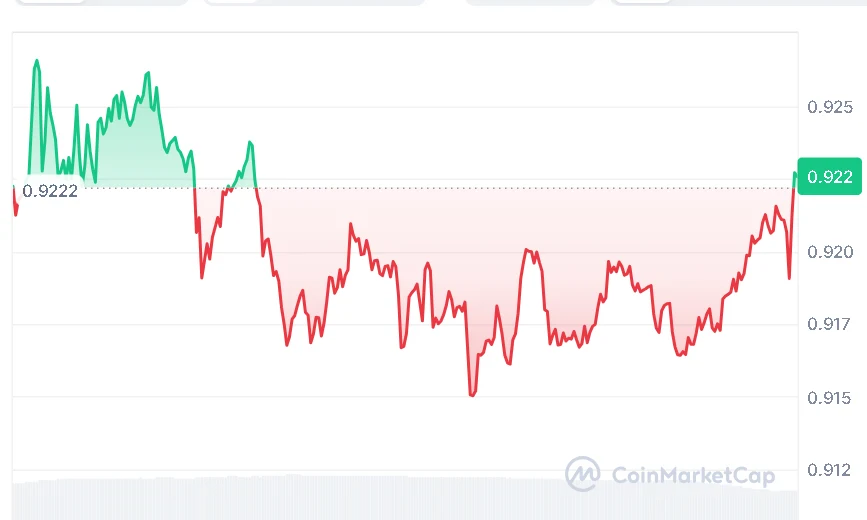

Source: CoinMarketCap
Also Read | Zcash (ZEC) Rally Above $380 Signals Possible Run Toward $420 Zone
SUI Stabilizes as Recovery Builds Momentum
A crypto analyst, BitGuru, observed, that SUI is coming out of a strong consolidation period, having experienced a brief downtrend. As per the analysis, the price is now trying to gain some balance around the level of $0.92. In case of a steady move higher, the next level of support can be expected in the range of $0.94-$0.96.

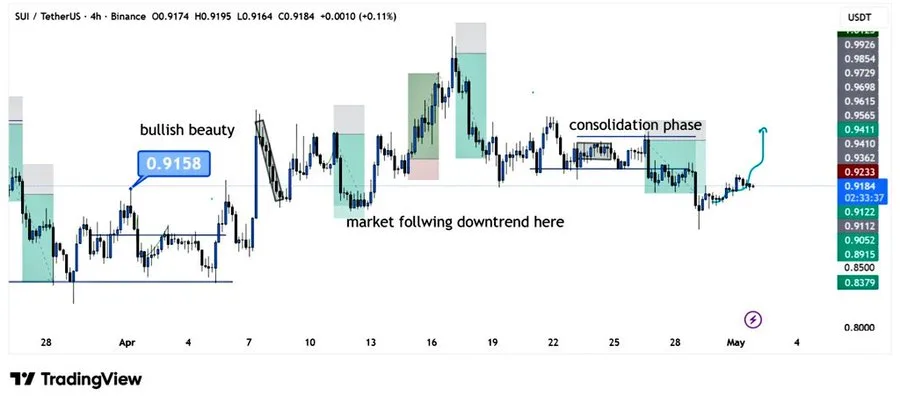
Source: BitGuru’s X Post
SUI Lacks Direction Amid Bearish Signals
Technically, SUI is not yet biased to any particular direction. This is evident from the fact that the RSI of SUI is hovering at 47.16, which is well below the neutral level of 50.
Moving Average Ribbon remains on its declining trend as prices continue to trade below its shorter-term averages, like $0.93379 and $0.94308. Its longer-term average of $1.39495 is way up top, reinforcing the overall bearish trend.

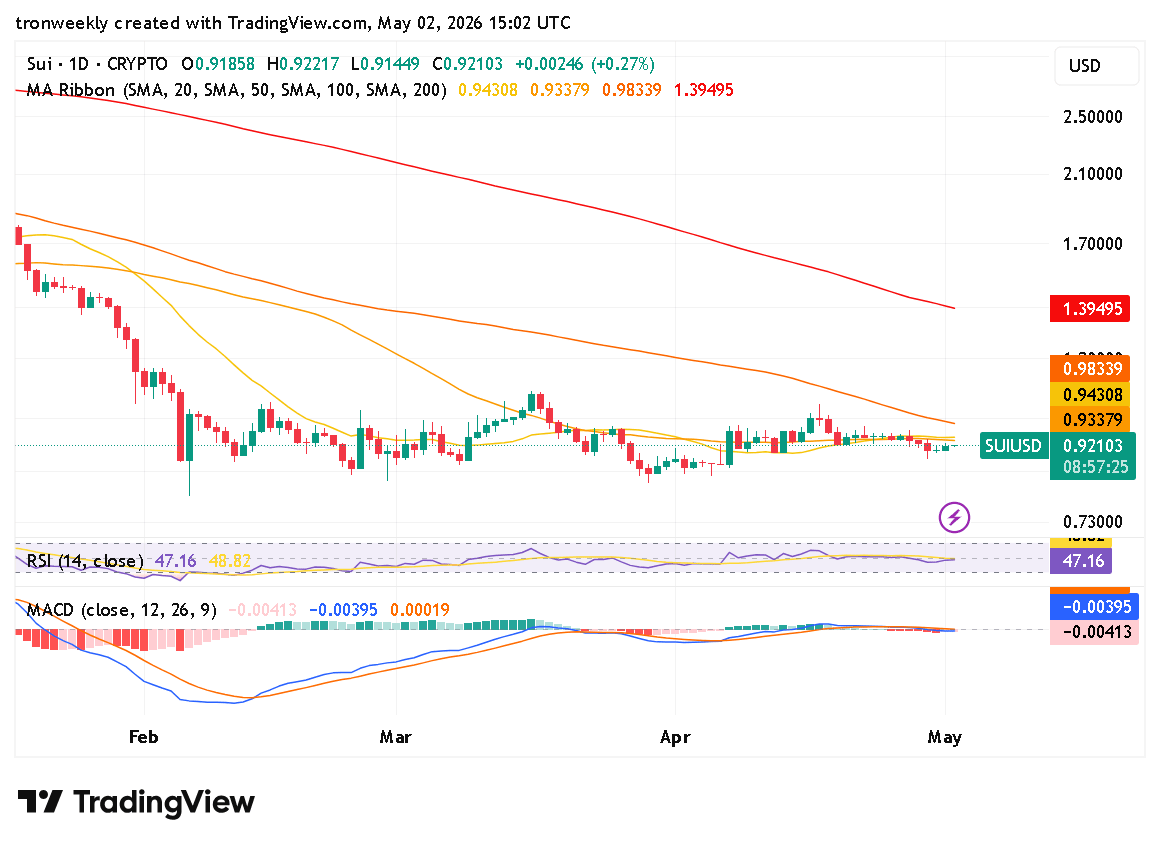
Source: TradingView
The momentum indicators are still bearish as well. Specifically, the MACD is below zero, where the MACD line is reading -0.00395, and the signal line is reading -0.00413.
Meanwhile, the histogram is flat, indicating that no one seems to have any control at the moment. Overall, the SUI appears to be range-bound for now.
This article contains market analysis and price predictions. These are not guarantees. Crypto markets are volatile. Always DYOR. Not financial advice.
Also Read | Bitcoin Faces Looming Quantum Threat as New PACTs Profers Solution
Be the first to comment