


What to know:
- SUI price faces renewed selling pressure while testing key support zone, with potential rally toward $1.42 if stability returns.
- RSI near 48 and MACD signals indicate declining momentum, suggesting bulls are gradually losing control.
- Key support levels at $1.05 and $0.97 remain crucial; bounce could trigger recovery, breakdown may extend losses.

SUI price is facing renewed downward pressure due to the failure to sustain its previous bullish momentum. This is because the token has begun declining even after recording a significant rally at the beginning of this month. Market players are now more cautious since the price of SUI is nearing a crucial support level.
At the time of writing, SUI is trading at $1.03 with a 24-hour trading volume of $808.44 million and a market capitalization of $4.12 billion. The SUI price has dropped by 3.58% over the last 24 hours, showing increased selling activity across the broader crypto market.
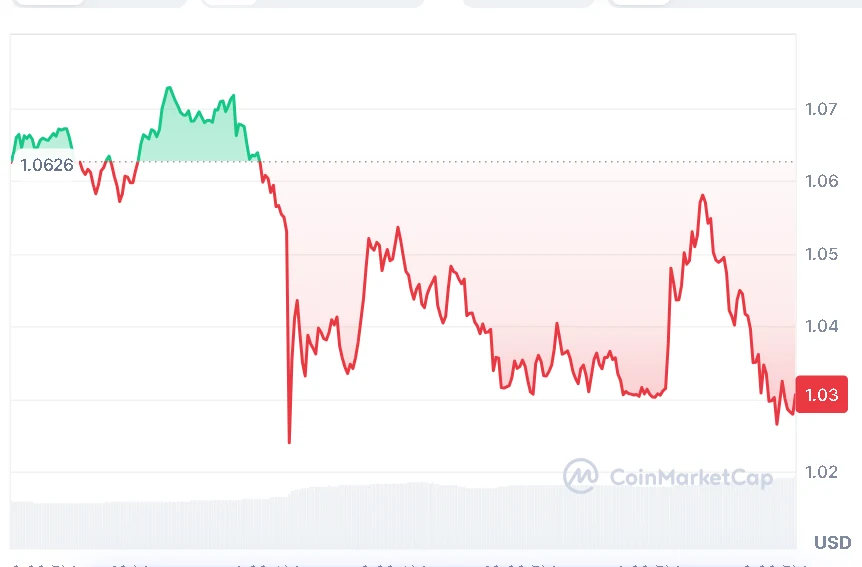

Source: CoinMarketCap

Also Read | Ethereum Exploit: Verus-Ethereum Bridge Suffers $11.4 Million Hack
SUI Price Near Key Support Zone
Crypto analyst BitGuru observed on May 18, 2026, that the SUI token is gradually approaching a strong support region after its latest pullback. The crypto analyst noted that when the price of SUI was trading in the same region previously, the token consolidated and eventually broke out strongly towards the $1.42 region.
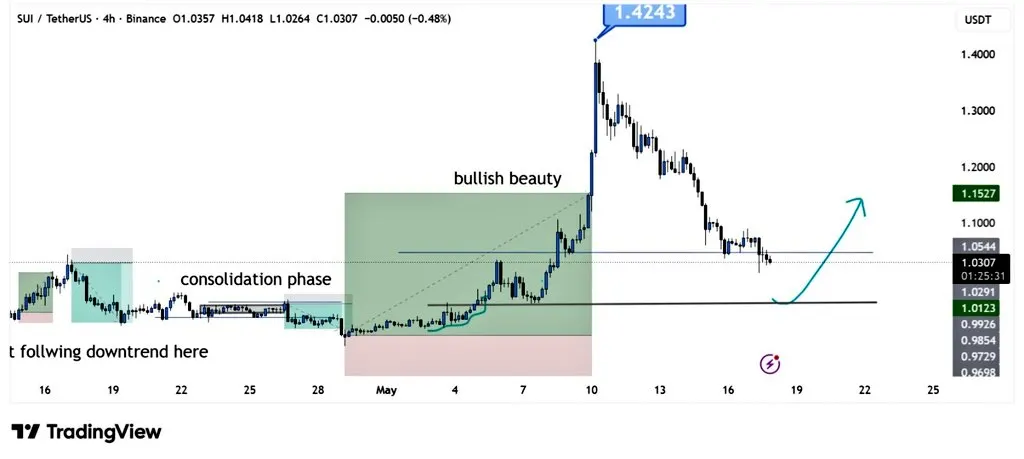

Source: BitGuru’s X Post
However, BitGuru observed that this level could once again be significant for the buyer if stability prevails in the market in the days ahead. At the moment, a lot of investors are paying close attention to how SUI manages to hold on to this level of support and gather enough strength for another attempt at an upward move.
SUI Price Pullback Shows Weakening Momentum
According to technical analysis, it appears that the bullish momentum on the stock price of SUI has started to fade since there has been a sudden rise in its value this month. The RSI stands at 48.14 compared to its recent high of 62.75.
The RSI has gone below the more bullish region, indicating that perhaps the bulls have lost their dominance gradually. However, it is near a neutral level, and hence, there cannot be any confirmation on the turn towards the bearish trend.
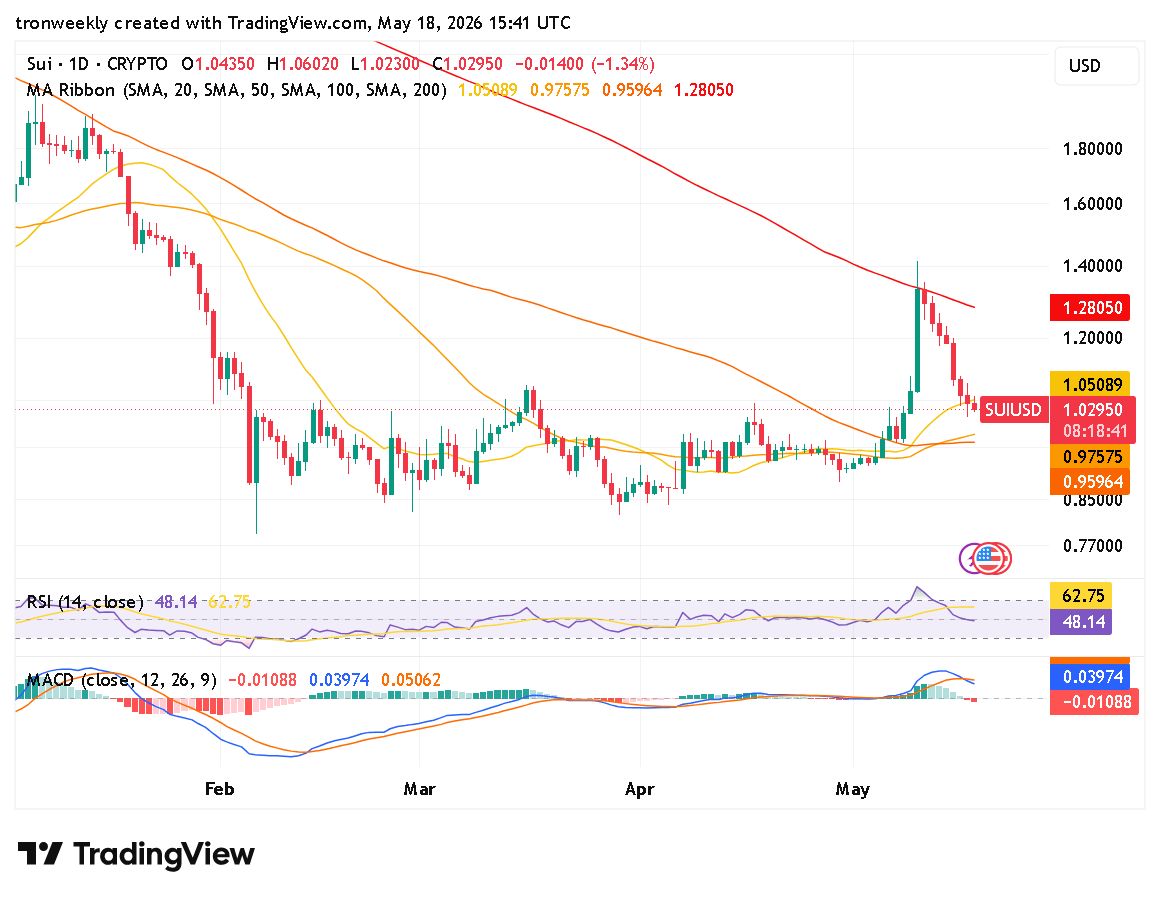

Source: TradingView
Meanwhile, the MACD oscillator is indicating declining momentum in the SUI price as well. As of now, the MACD oscillator stands at -0.01088 while the signal line is still above the former at 0.03974. Moreover, the histogram is printing shorter red bars, indicating slowing buying momentum following SUI’s run to $1.40.
Assuming that the weakness persists, investors might pay close attention to the $1.05 and $0.97 support levels, as a bounce off these levels would assist in driving the SUI price upwards. Meanwhile, a continuation of the weakness would see the price fall further.
This article contains market analysis and price predictions. These are not guarantees. Crypto markets are volatile. Always DYOR. Not financial advice.
Also Read | AI Agents in Crypto: Citadel CEO on Speed, Risk, and Blockchain Impact in 2026

Be the first to comment