



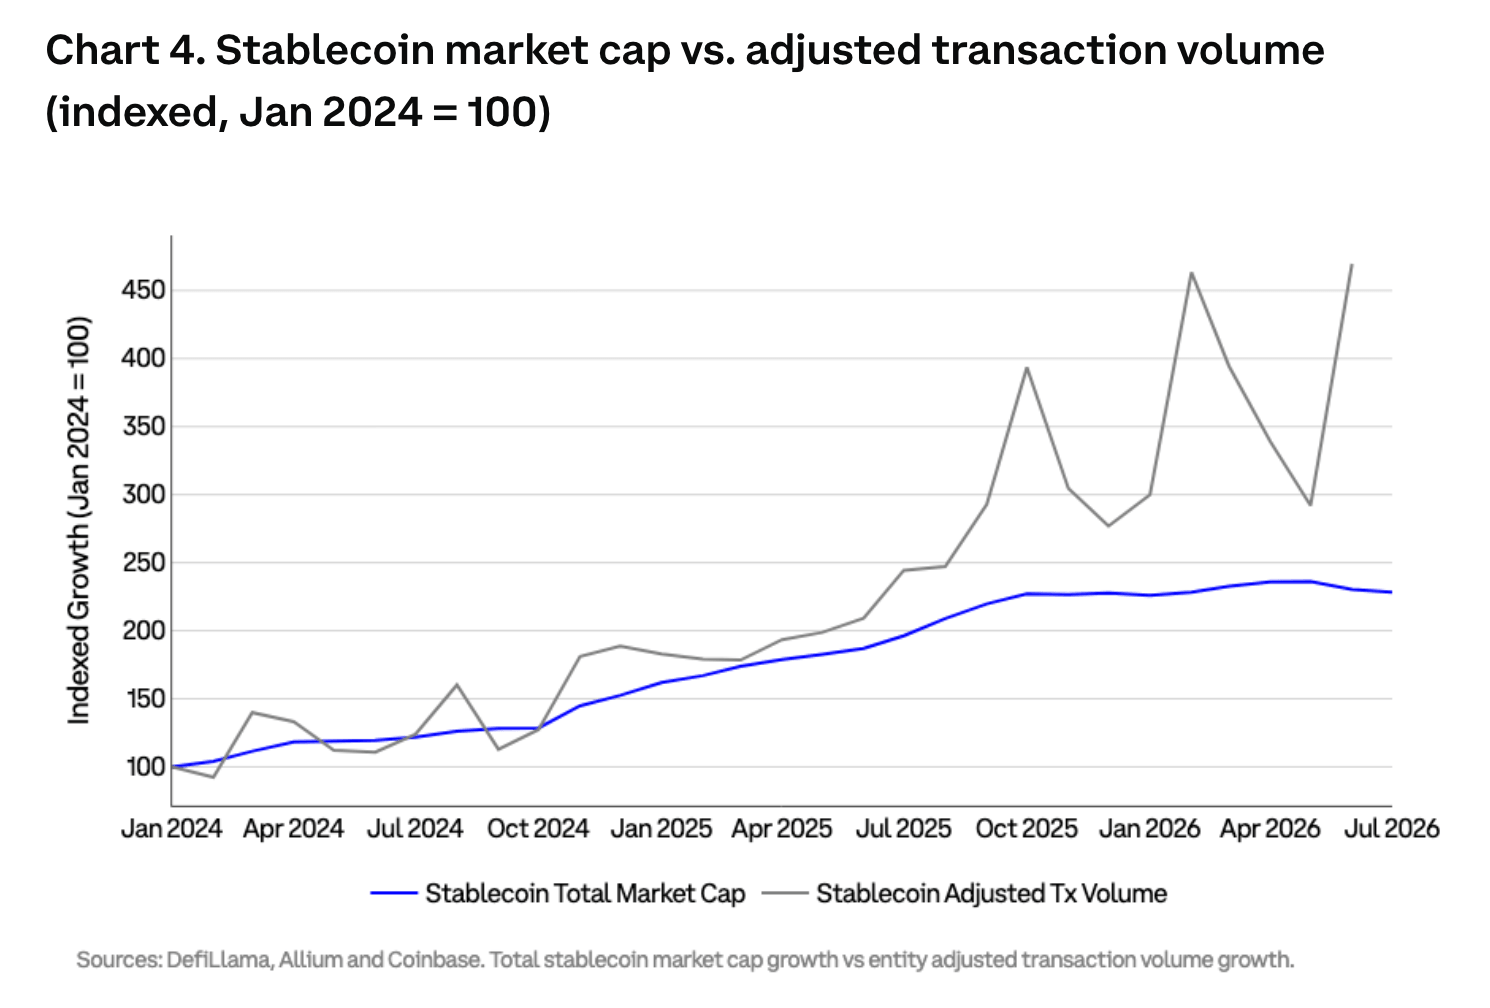
Stablecoin supply has roughly doubled since January 2024, while entity-adjusted transaction volume has grown fourfold to fivefold, according to Coinbase Institutional, opening a wide gap between the amount of dollar liquidity held onchain and the volume of activity that liquidity supports.
Market capitalization records the stock of stablecoins in circulation, which captures available liquidity, reserve demand, and issuer scale. Transaction throughput, on the other hand, records how intensively those tokens move through exchanges, payment systems, treasury accounts, and settlement workflows.
A system holding $500 billion that moves infrequently offers greater capacity than one holding $250 billion, but the smaller system can support more economic activity when each dollar changes hands repeatedly. Stablecoins are now moving toward that second model, where network value increasingly reflects how much can be settled with the existing pool of digital dollars.
Coinbase’s indexed comparison shows the shift clearly: stablecoin market capitalization has roughly doubled from its January 2024 level, while adjusted transaction volume has grown several times faster. Monthly adjusted volume has climbed from a few hundred billion dollars in 2023 to well above $1 trillion in recent months, indicating that each unit of supply is circulating more frequently.

Supply captured stablecoins’ exchange era
Market capitalization became the standard adoption measure because it suited the first major use of stablecoins. Traders held Tether’s USDT, Circle’s USDC, and other dollar-linked tokens on exchanges, where they served as trading capital, derivatives collateral, DeFi liquidity, and shelter from volatile crypto assets.
Under that structure, additional supply almost always represented additional demand. Rising balances suggested that more capital had entered crypto, deeper liquidity was available across markets, and traders had accumulated greater purchasing power. Redemptions often accompanied falling activity and were a clear sign of capital leaving the ecosystem.
However, stablecoins have now spread into institutional treasury accounts, cross-border transfers, payment applications, and tokenized markets. One token can now settle several transactions before its holder redeems it or returns it to an exchange, allowing activity to grow faster than the underlying supply.
So now supply looks and works more like installed capacity, while throughput shows actual utilization. A larger float gives the market more liquidity to deploy, but faster circulation lets the same float support more activity.
Monetary velocity describes how frequently a unit of money changes hands during a given period. A $100 bill held in a drawer generates little transaction activity, while the same $100 can pay a worker, who pays a supplier, who pays a freight company, which then pays another business. The quantity of money stays constant as the value settled through it accumulates.
We can apply the same principle onchain. Stablecoin velocity is generally calculated by dividing transaction volume by outstanding supply, though the result depends heavily on which transfers enter the numerator.
Raw blockchain data can include exchange sweeps, automated routing, arbitrage loops, and transfers between addresses controlled by the same entity. Entity-adjusted datasets group related addresses and filter activity judged to have limited independent economic substance, producing a closer estimate of genuine financial transfers.
CryptoSlate’s analysis of automated stablecoin activity illustrates the scale of that distinction, with gross blockchain totals shrinking sharply once internal, bot-driven and other non-economic transfers are removed.
Coinbase’s figures use entity-adjusted volume. Even after those filters, activity has grown much faster than supply, supporting the conclusion that stablecoins are circulating more intensively.
The metric can’t identify the purpose of every transfer. Trading, arbitrage, collateral movements, and treasury rebalancing still account for a large share of activity, and a sharp monthly increase may reflect financial-market turnover more than household spending. Those transactions remain economically significant because they use stablecoins as settlement instruments.
Visa’s Economic Empowerment Institute calculated total stablecoin velocity at 13.56 during the fourth quarter of 2025, meaning the average token changed hands more than 13 times during the quarter. US M1 velocity stood at 1.65 over the same period.
While the difference is stark, it’s important to note that these numbers describe different forms of activity. M1 velocity links cash and checking deposits to spending on goods and services, while total stablecoin velocity includes investment, trading, funding, liquidity management and settlement.
Visa tested a retail proxy by isolating stablecoin transfers worth $250 or less. That measure produced velocity of 0.08 in the fourth quarter, and retail-sized transfers represented less than 1% of total stablecoin activity. Everyday purchases therefore remain a small part of overall turnover.
A wholesale benchmark provides a closer comparison. Visa calculated Fedwire velocity at 93.84 for the same quarter, almost seven times the stablecoin figure of 13.56. Stablecoins have developed meaningful financial turnover, but the established US wholesale system still processes value at a far greater intensity relative to the reserve balances supporting it.
The comparison puts stablecoins between two categories. Their total velocity exceeds the velocity of retail money because financial activity dominates their use, while their relative turnover remains below Fedwire. That position supports the settlement infrastructure thesis without treating stablecoins as a replacement for consumer money or wholesale banking systems.
Payment networks report payment volume and transaction counts, ports track cargo movement, communications networks monitor traffic, and wholesale settlement systems measure the value transferred across them. Their economic significance comes from the activity they carry.
When it comes to stablecoins, circulating supply establishes the available pool of dollar liquidity, while throughput shows whether businesses, financial institutions, and crypto markets are using that pool to settle recurring activity.
This leaves us with two forms of growth, where new issuance expands capacity, and faster circulation raises utilization. Coinbase’s data suggests utilization has become the stronger force since early 2024.
CryptoSlate has traced the same development across the payments industry, where Visa, Stripe and Mastercard are building stablecoin settlement systems beneath familiar consumer and business products. A customer may still interact with a card, bank account or payment application, while tokenized dollars handle part of the institutional transfer behind the transaction.
We’ve already seen this change affect operating businesses. DoorDash’s work on stablecoin-powered payouts shows how global platforms are exploring faster movement between corporate accounts, merchants and workers, where settlement speed affects working capital and access to earnings.
Throughput is reshaping stablecoin competition
The difference between supply and throughput is changing how competition looks between the two largest stablecoins. USDT retains the largest circulating supply and broad distribution across global trading venues, while USDC has captured a growing share of adjusted transaction activity.
Coinbase’s July analysis placed USDC’s share of adjusted stablecoin volume at roughly 70%, up from the mid-20% range in 2024. USDT continued to lead by outstanding supply, dividing stablecoin leadership into two categories: dollars held and dollars moved.
Coinbase associates USDC’s rising share with regulated financial activity, payments, settlement, and treasury operations. Trading, arbitrage, and liquidity management also contribute to the number, so the data points to high institutional turnover, not consumer adoption.
CryptoSlate documented the same divergence when USDC moved ahead of USDT in adjusted transfer volume, even as Tether preserved a much larger supply base. More recent network data showed USDC accounting for about 67% of June’s adjusted stablecoin volume, with activity increasingly distributed across Base and Ethereum.
The numbers show that the largest stablecoin balance and the busiest stablecoin settlement network don’t have to be the same thing.
Coinbase found that weekends have consistently accounted for roughly one-fifth of adjusted weekly stablecoin volume across several years, giving the market a steady stream of settlement activity outside the standard windows used by many banks and corporate treasury systems.
This has nothing to do with crypto conviction: institutions are looking for settlement availability, and stablecoins are the best way to get it. Card authorizations continue through weekends, and FedNow supports instant payments around the clock, but Fedwire treats Saturdays and Sundays as holidays under its current schedule, and ACH operates through defined processing windows. Stablecoins can transfer on public blockchains throughout the week without depending on a bank business day.
That gives stablecoins a practical advantage in global markets, where counterparties operate across time zones and crypto trades continuously. Capital can move between an exchange, market maker, custodian, or treasury account on Saturday through the same blockchain process used during the working week.
CryptoSlate has covered this advantage for years, including Checkout.com’s introduction of round-the-clock USDC settlement for merchants. The persistent weekend share now shows that continuous availability has developed into recurring use across the wider market.
The next winners will control stablecoin movement
On July 16, Visa introduced its Stablecoin Platform, an enterprise service that gives financial institutions, fintech companies, and crypto businesses access to stablecoin operations through a Visa-managed environment.
The beta platform begins with Open USD and includes wallet infrastructure, minting and burning connectivity, bank-account links, transfers, redemption, approval controls and audit logs. Visa says the service can connect stablecoins with its existing settlement, card and money-movement products.
The launch follows the formation of the broader Open USD network, where Visa, Mastercard, Coinbase and more than 100 other companies joined a partner-led stablecoin initiative built around distribution and usage.
The product shows just how much competition there already is in this space. Institutions need custody, compliance, treasury controls, wallet administration, fraud management, and links to bank accounts before stablecoins can become routine operating tools. Issuers earn income from reserve assets, while payment companies and service providers can capture value each time those tokens move.
Stablecoin supply remains central to issuer economics because reserve assets generate interest income, while a larger float deepens liquidity and expands transaction capacity. It also increases demand for Treasury bills and other short-duration assets.
CryptoSlate has tracked how stablecoin reserves have become a significant source of Treasury demand, giving supply growth a direct connection to government funding markets and issuer profitability.
Throughput, on the other hand, creates a separate source of economic value. Payment processors, custodians, banks, blockchain networks, compliance firms, and tokenization platforms can participate in stablecoin movement even when they issue none of the underlying dollars.
A high-volume network can generate demand for transaction processing, foreign-exchange conversion, identity controls, fraud monitoring, and treasury services. A large supply base can produce substantial reserve income with a lower circulation rate. The strongest businesses want to combine both models, using a broad float to attract liquidity and operational services to capture recurring activity.
Stablecoin adoption is entering a phase where market capitalization provides the capacity figure and velocity provides the utilization figure, giving analysts a better way to separate digital dollars held inside the system from those supporting repeated financial activity.
Coinbase’s fourfold to fivefold increase in adjusted volume, USDC’s growing share of that activity, and the persistent weekend contribution all point toward a market whose strongest expansion is occurring in settlement intensity. Visa’s research shows where the boundary is: stablecoins currently resemble wholesale financial instruments more closely than consumer cash, and their relative turnover remains far below Fedwire.
The next stablecoin leaders may include issuers with the largest reserves, payment companies connecting tokens to merchants and banks, custodians managing institutional balances, or blockchain networks carrying the highest-quality settlement flows. Their position will depend on how much value they can move, how reliably they can move it, and how deeply those transfers become embedded in recurring financial operations.
Stablecoins are beginning to resemble payment networks more than digital bank balances. As that transition advances, supply will show how much capacity the system holds, while throughput will show how much economic work the system performs.





Be the first to comment