



The Graph [GRT] surged 15% to set a new local high on the chart, at press time. The surge shows strong momentum backing the asset, especially as its volume was up 180% to over $37 million in the past day.
However, the data suggests there is another key warning that needs to be considered. Short positions, or sellers, are not just sitting on the sidelines. They are gradually betting on a decline.
Binance top traders impact the market
There is clear evidence suggesting that top traders on Binance, based on account and position size, are leaning very bullish.
This is based on the Long/Short Ratio, which tracks the accounts and positions of Binance traders in the market, showing readings of 1.84 and 1.76, respectively.

The Long/Short Ratio measures whether buyers or sellers are dominating the market based on whether its reading is above or below 1. A reading above 1 indicates buying volume dominance, while a reading below 1 suggests sellers are taking charge.
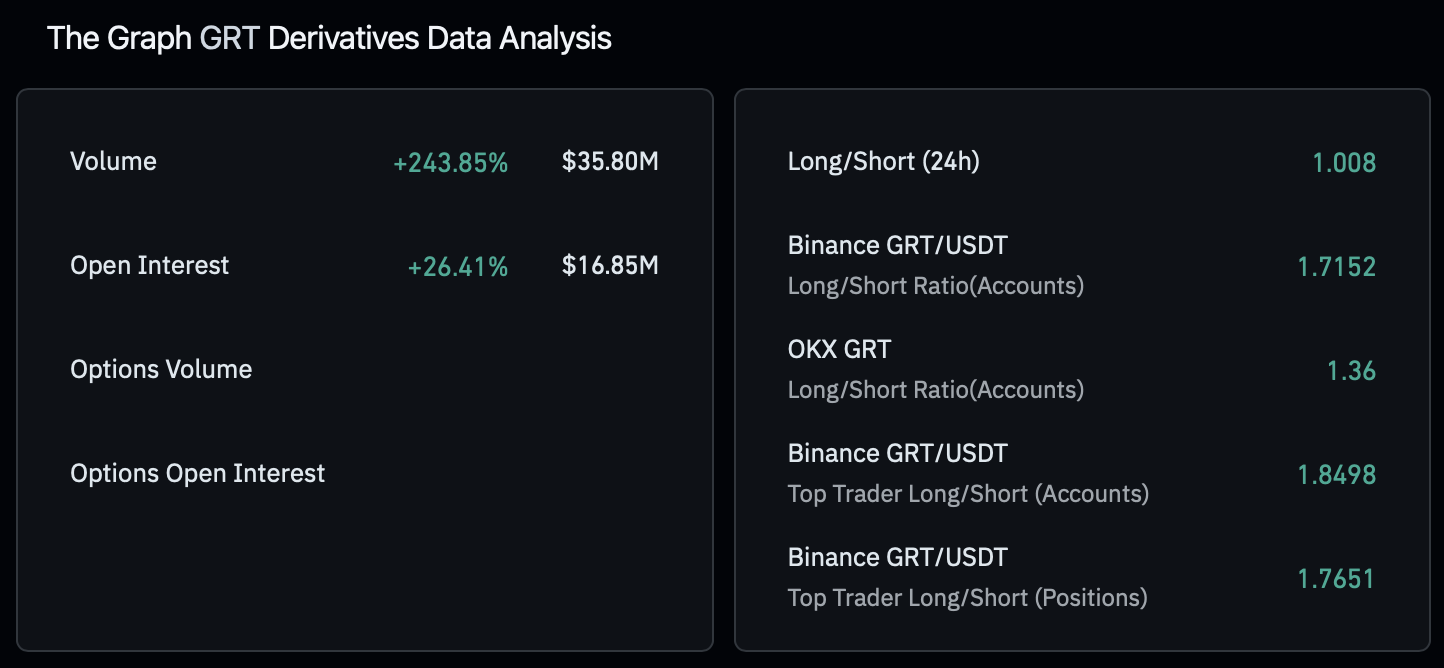
The farther the ratio moves from 1, the stronger the buying or selling pressure in the market. At the time of writing, the data reflected a clear bullish bias.
Across multiple exchanges where GRT is trading, volume performance has also been overall bullish. CoinGlass reported that the Long/Short Ratio across these venues reached roughly 1.008, indicating growing long dominance.
GRT retail traders are forced to buy
The surge in buying volume across centralized exchange venues, along with the bullish positioning of Binance’s top traders, may have a wider effect on the broader retail market.
The Whale vs. Retail ratio shows that the market remains largely whale-driven, as the delta remains positive at 0.145 as of writing.
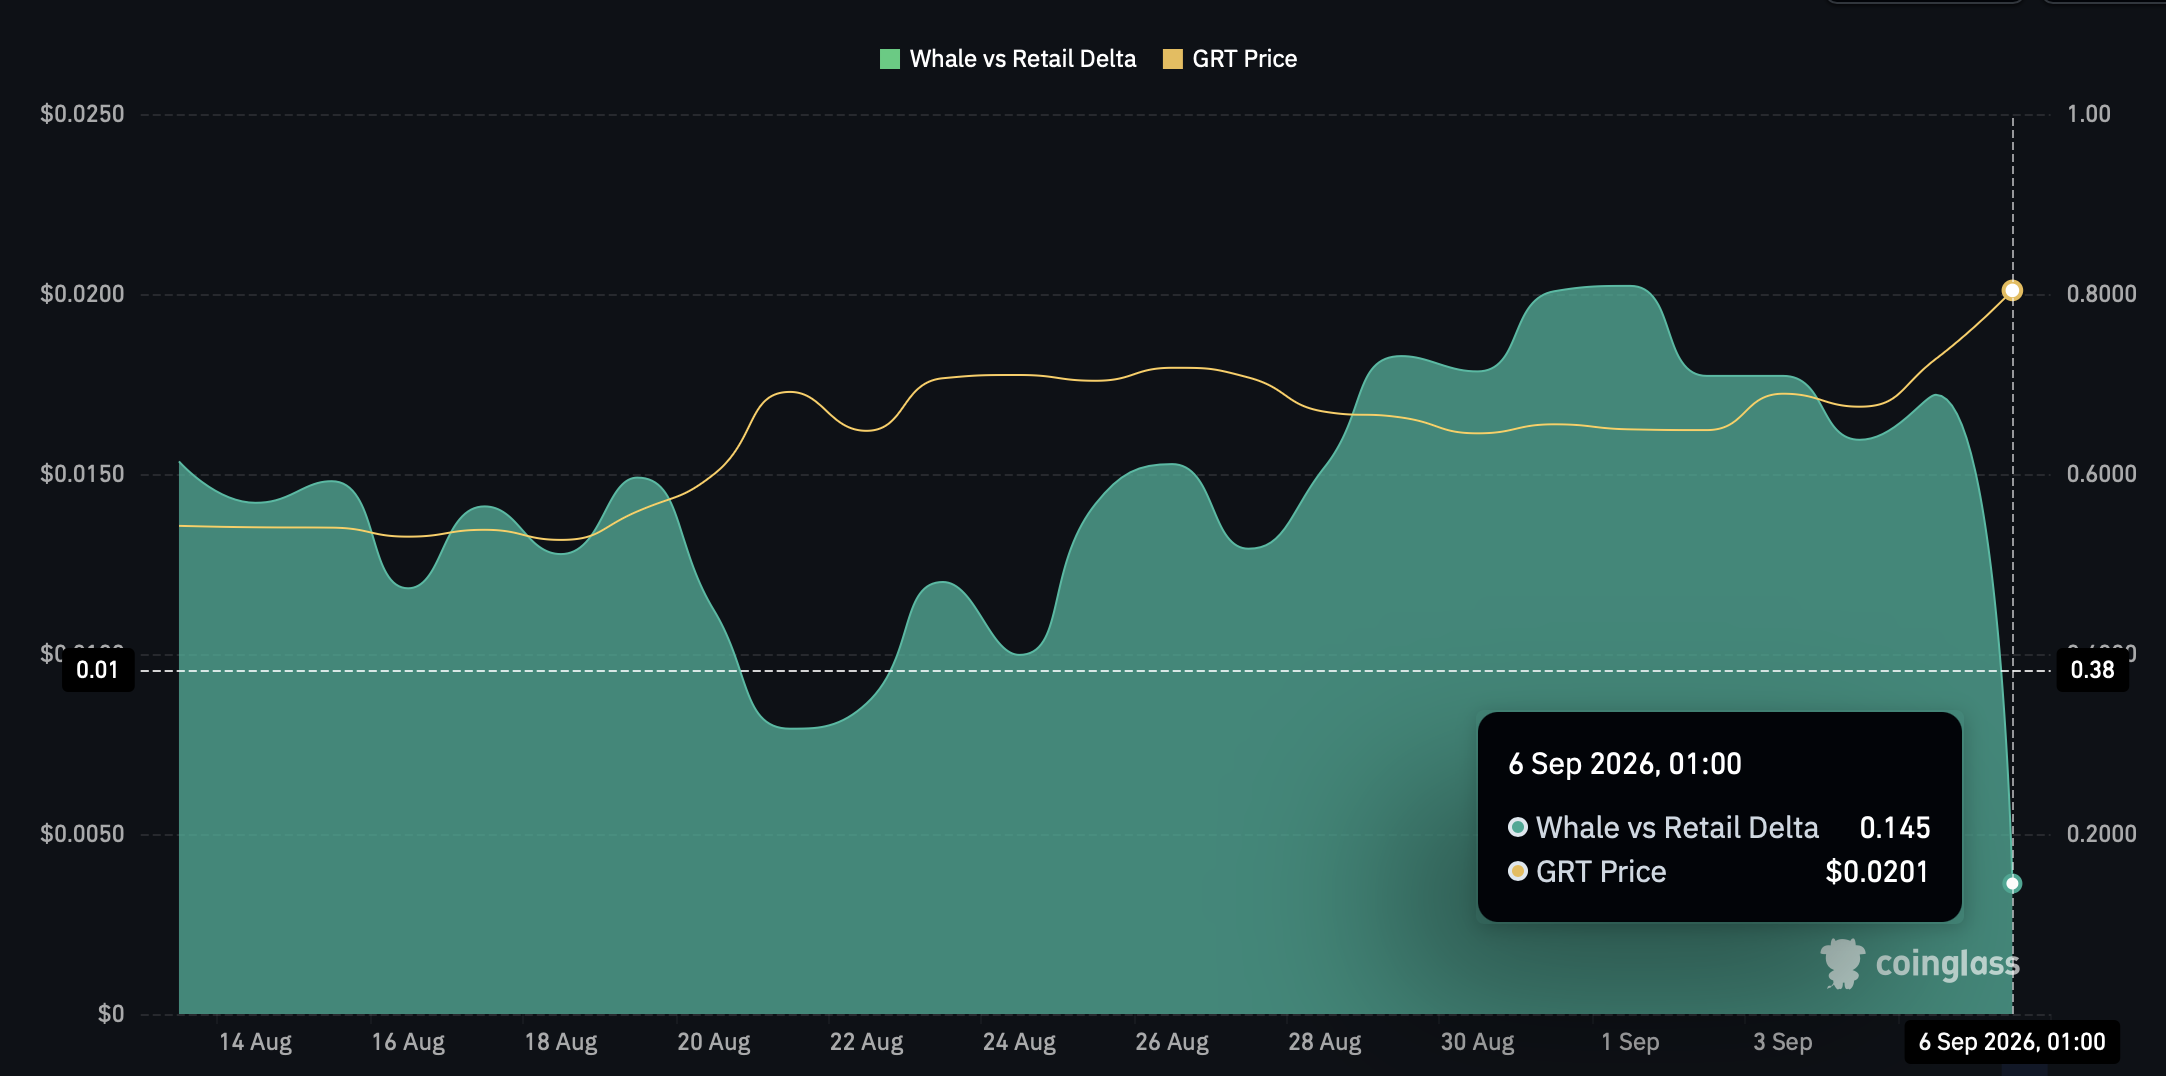
However, the delta also shows that retail traders have been heavily involved in influencing GRT’s price direction. Since the 5th of September, the delta has dropped sharply from 0.688 to 0.145.
A decline of this scale can occur when there is significant retail involvement in the market, which can also have a positive impact on price.
There’s a need to be bothered
The Funding Rate and spot profit-taking in the market remain key threats to the asset’s price.
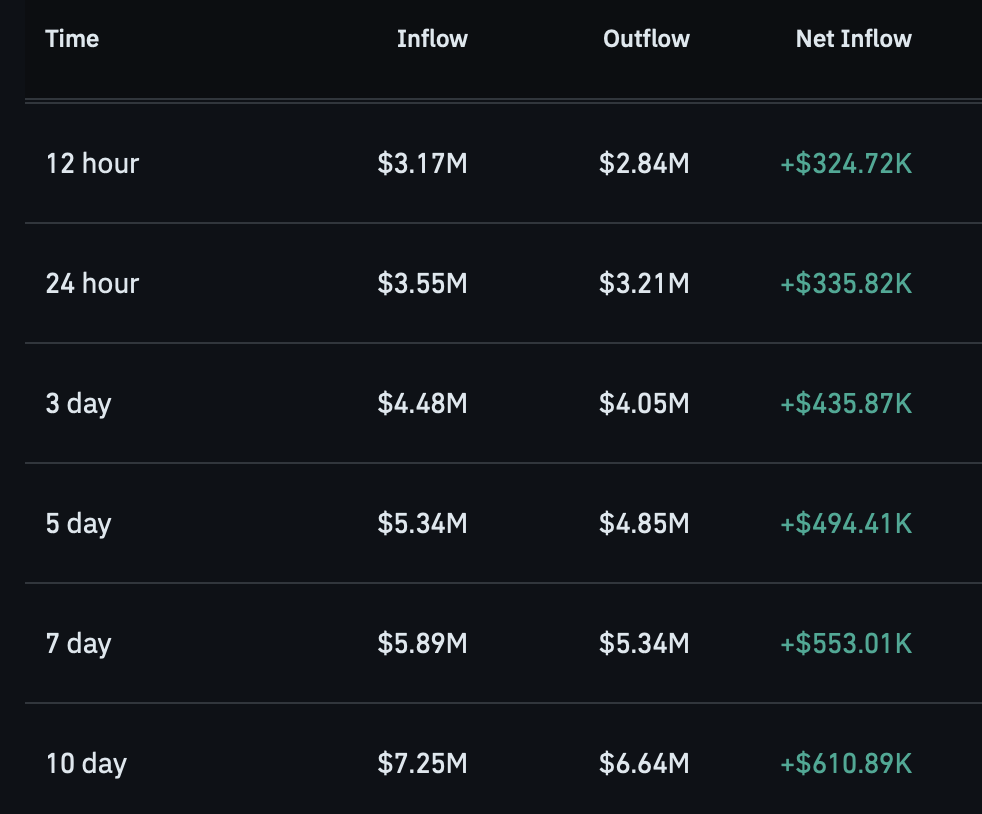
Spot market netflows have remained consistently positive over a period of more than 15 days. In the past 24 hours, netflows reached roughly $335,000 on the chart.
Positive netflows imply that more of the asset has flowed into exchanges than out of them during that period, which can indicate increased selling pressure.
Likewise, the Funding Rate has plummeted, dropping from a high of roughly 0.0045% to about 0.0005%, implying that short positions are continuing to grow.
The combined impact of spot selling and the decline in the funding rate suggests there is a high chance that the asset could swing lower.
Final Summary
- GRT jumped 15% to $0.02 as trading volume surged 180% to more than $37 million, showing strong bullish momentum.
- Rising spot netflows and a sharp funding rate decline suggest sellers could push GRT lower.



Be the first to comment