



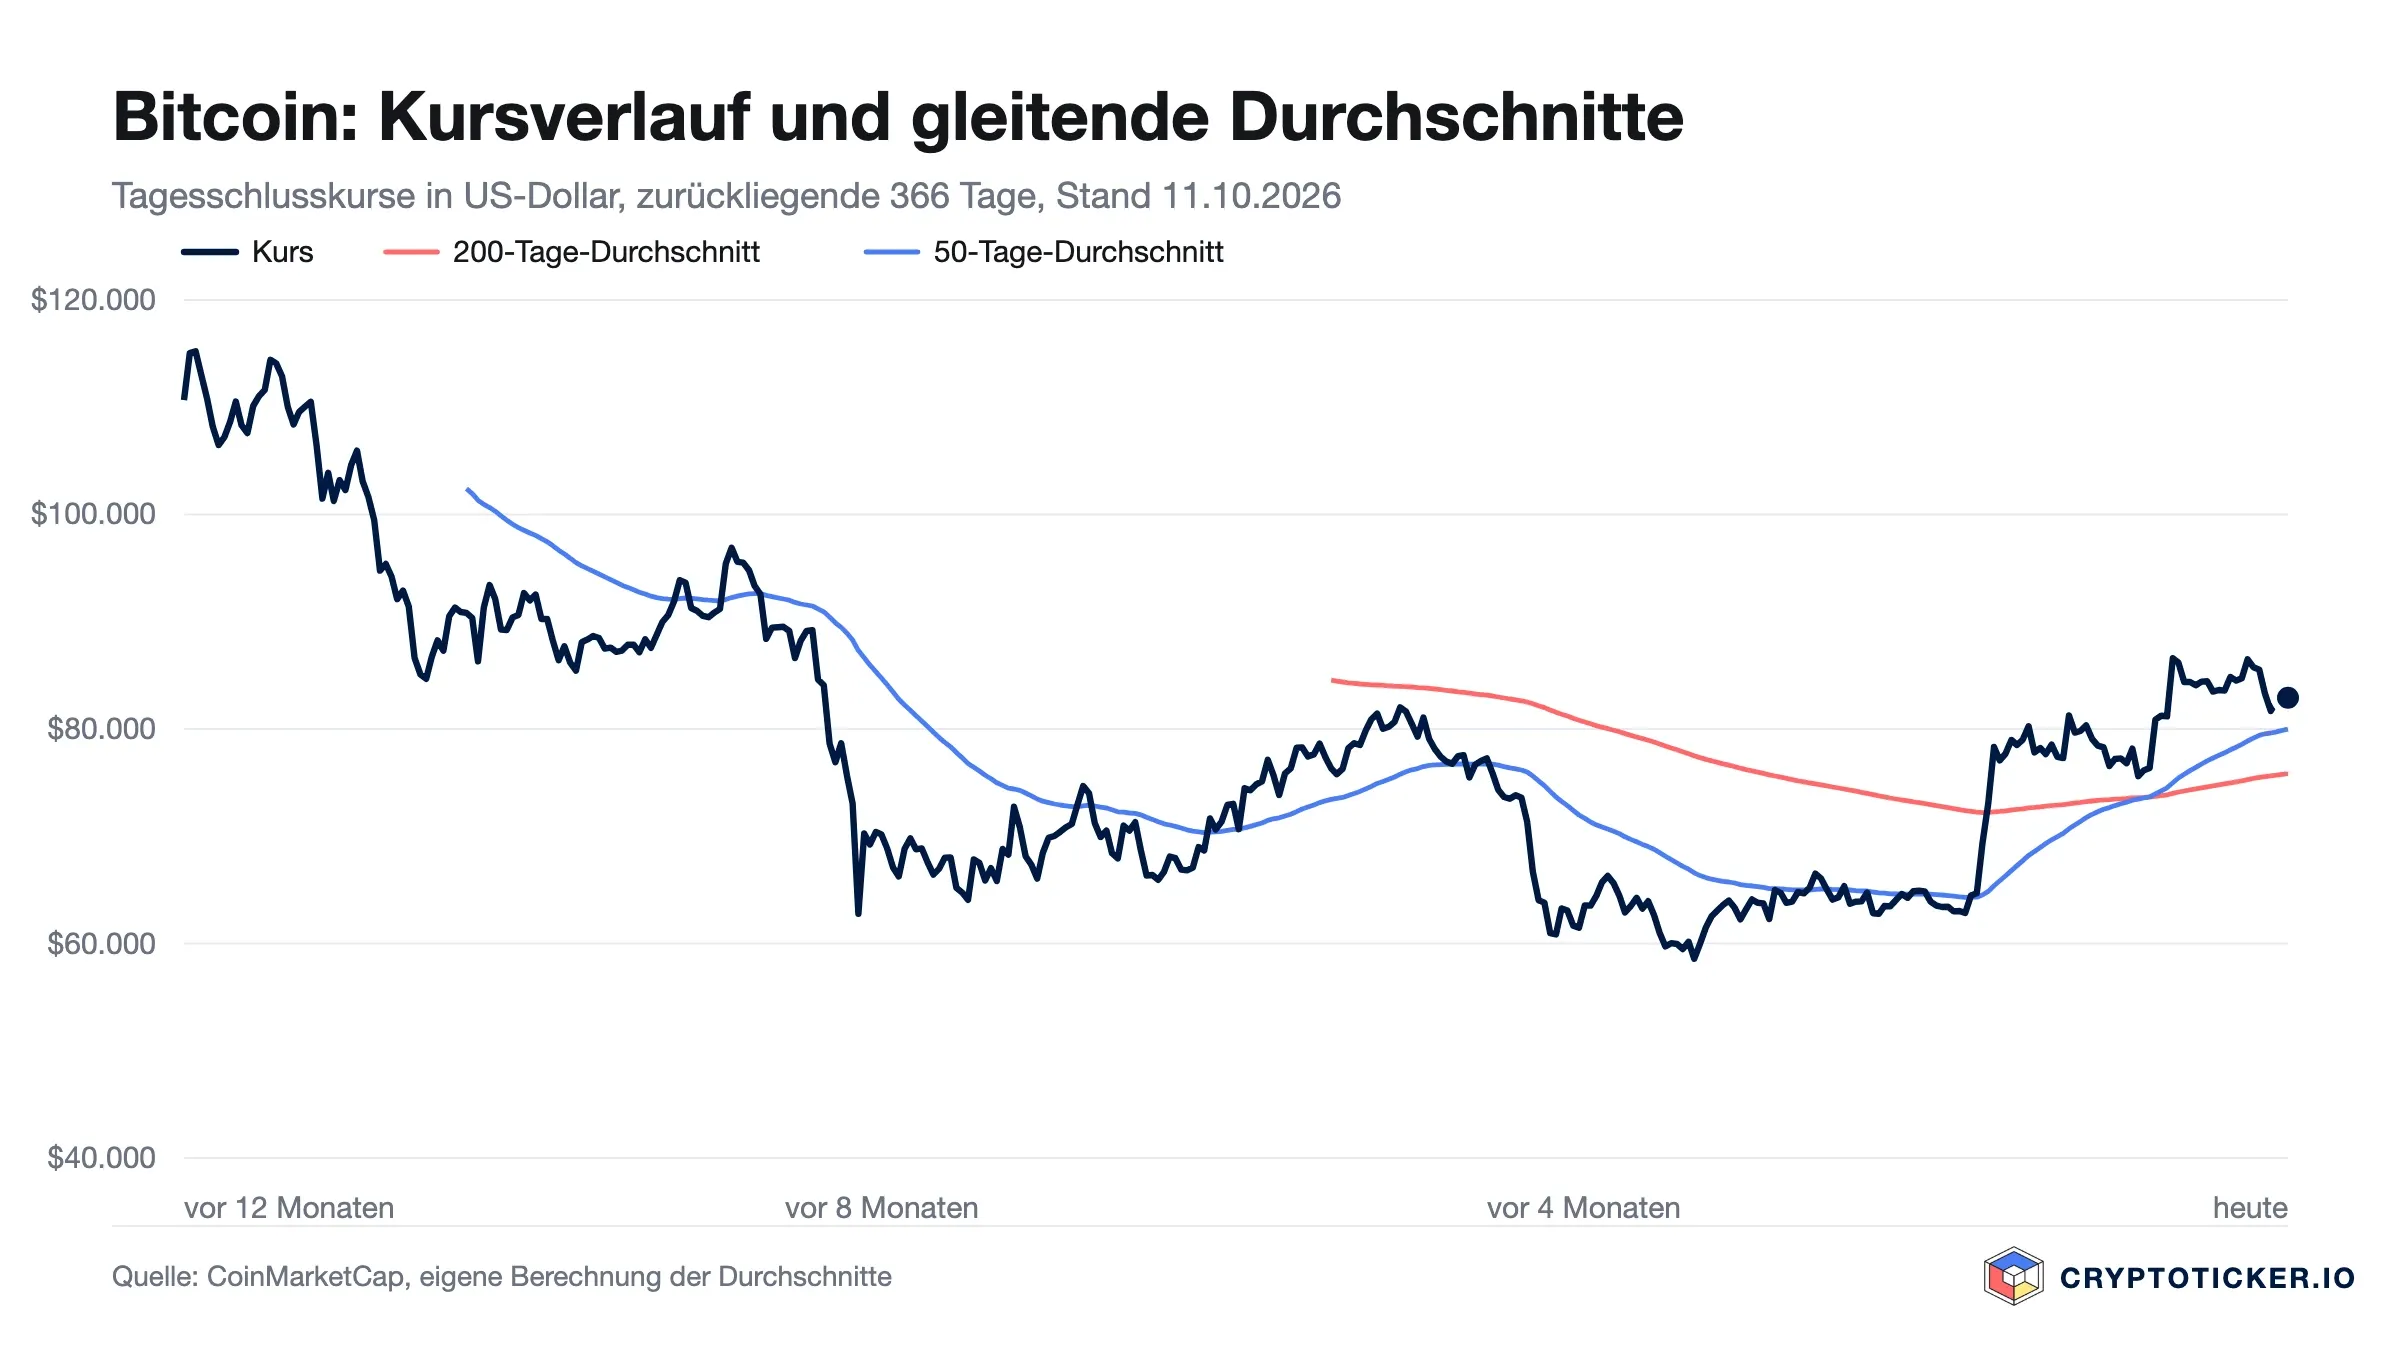
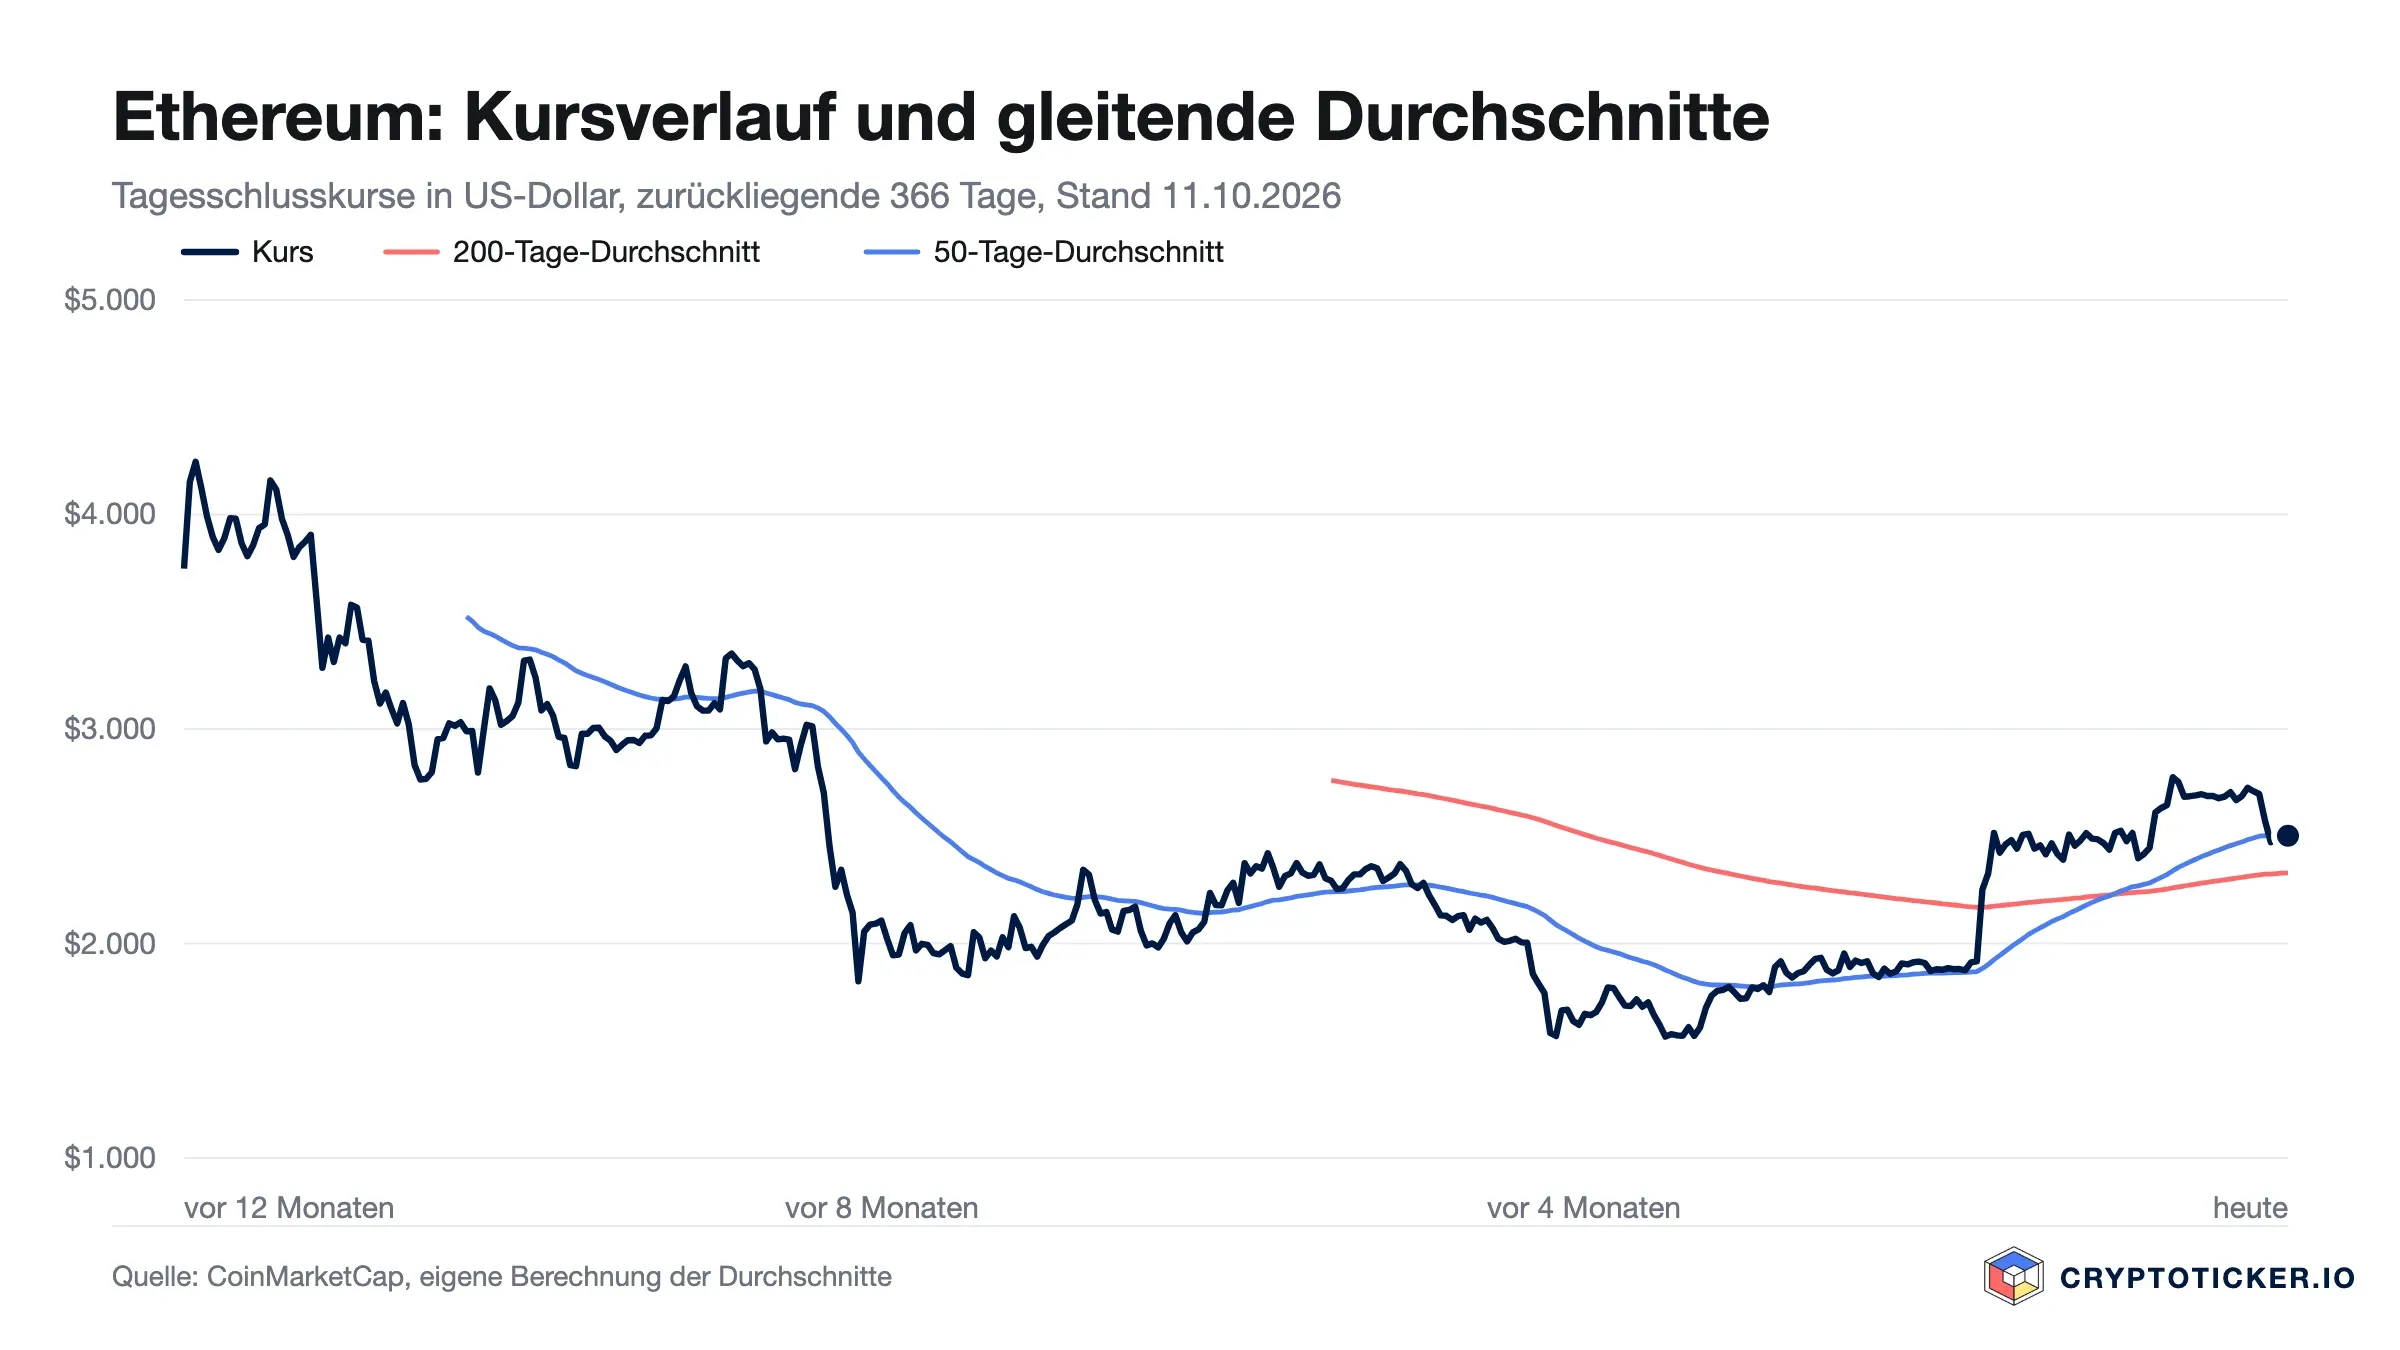
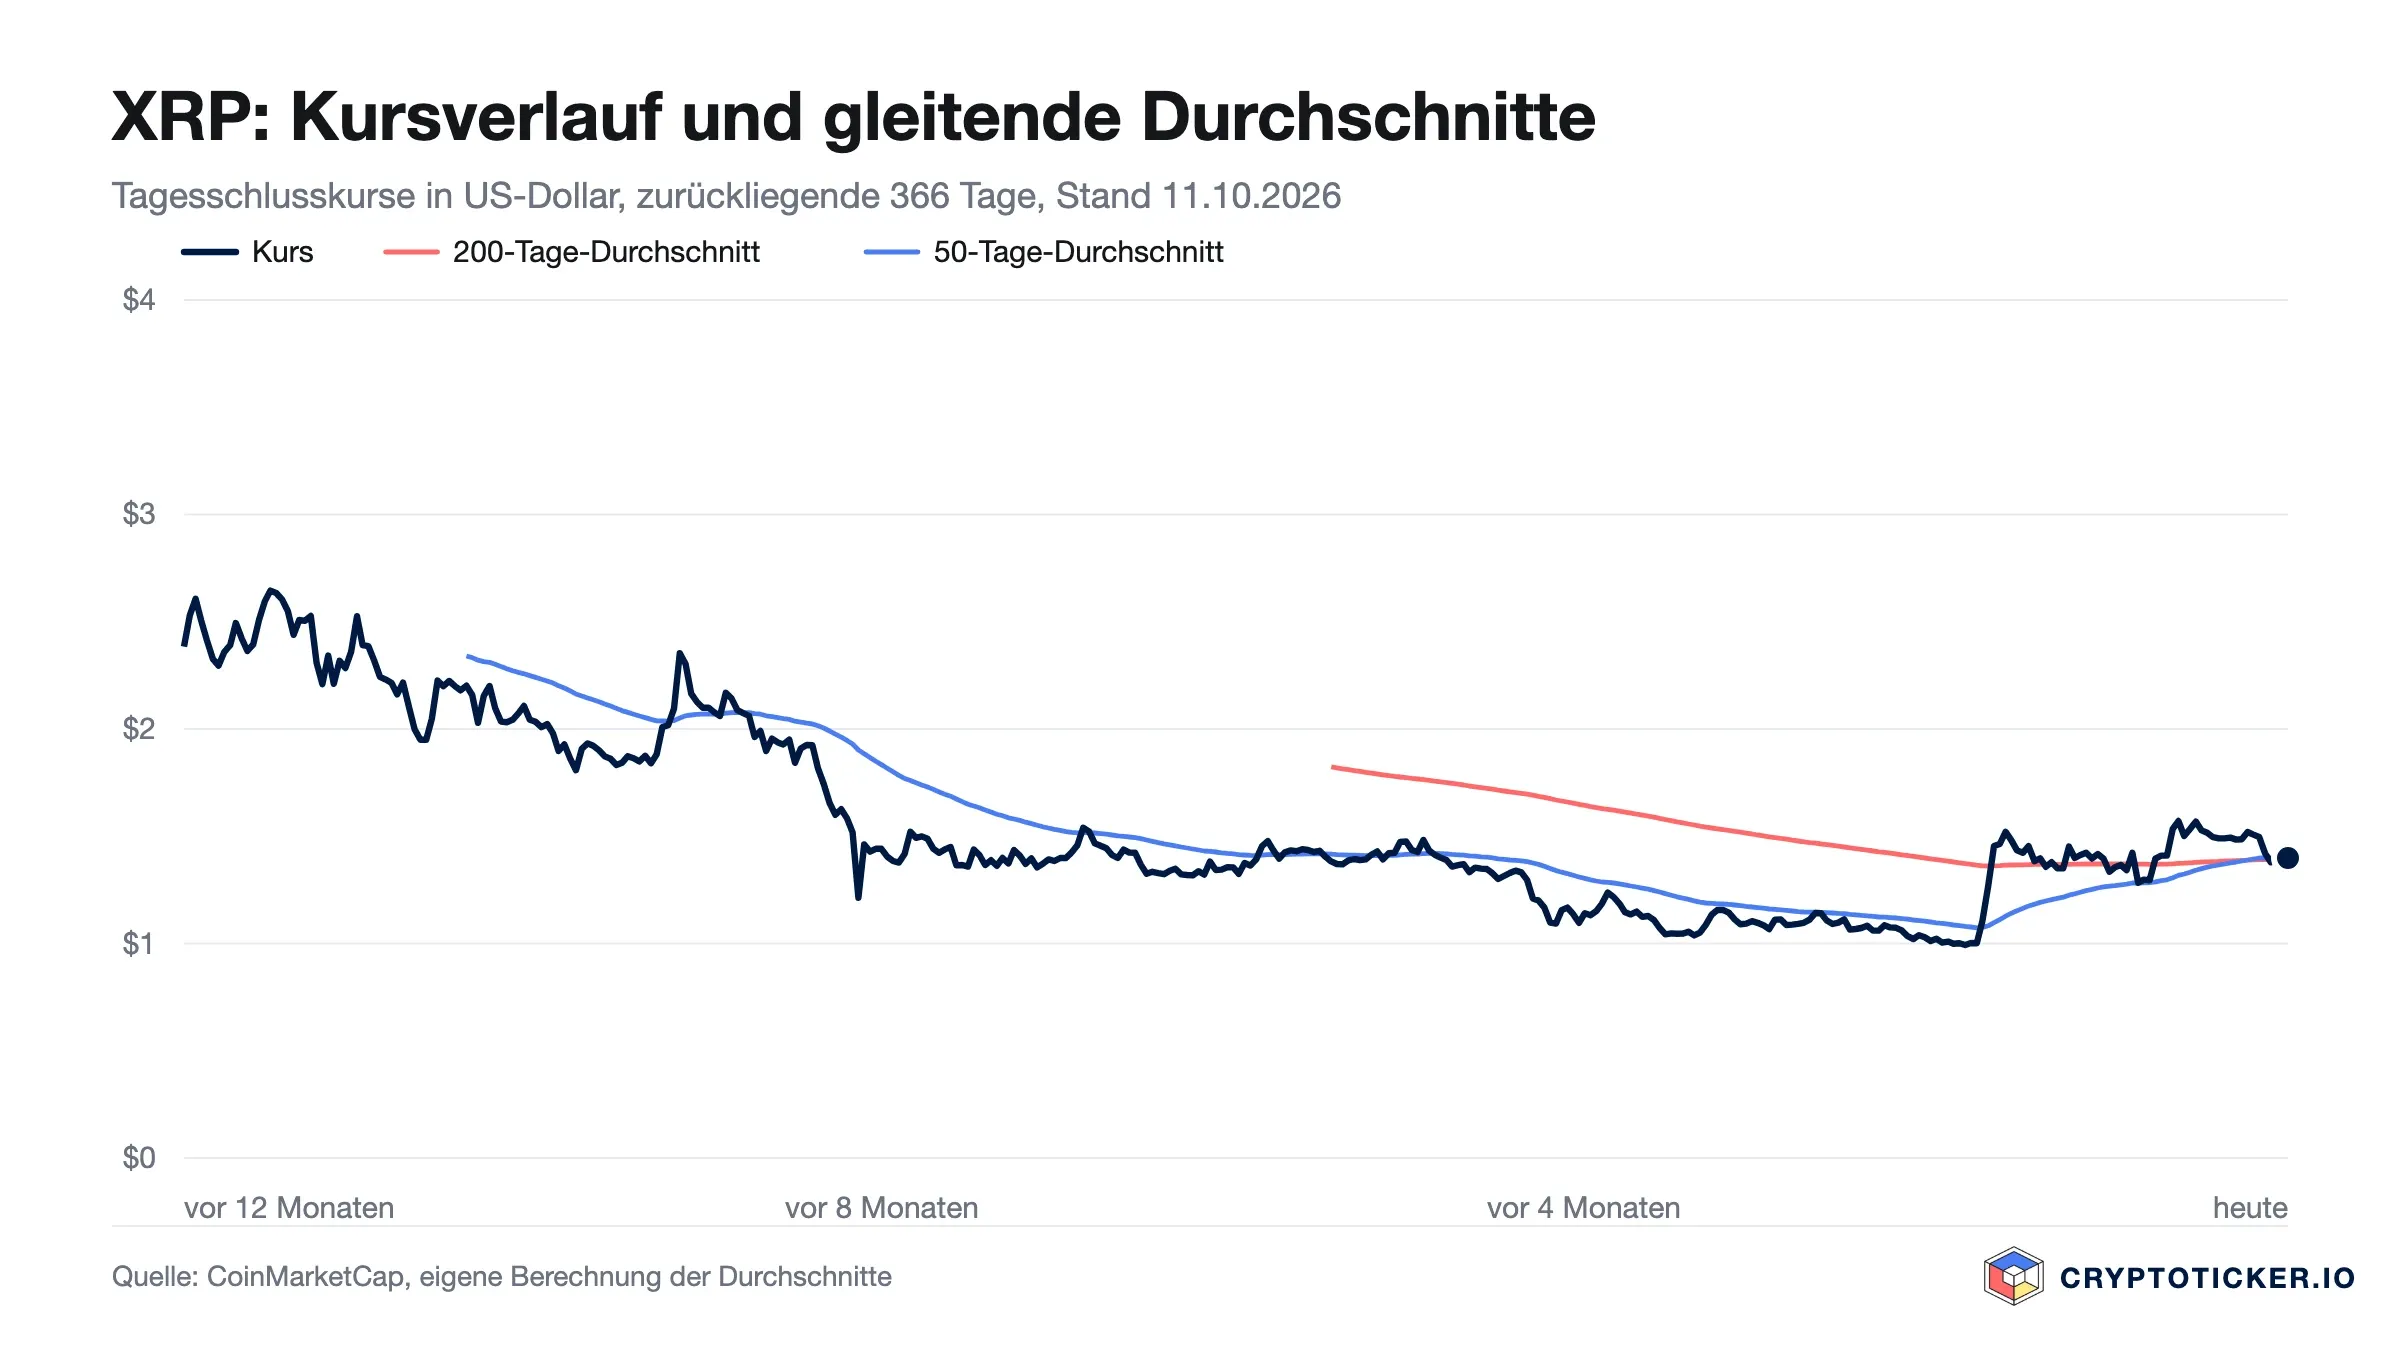
The new crypto week has a clear centre of gravity: on Wednesday, October 14, the US publishes the consumer price index for September at 8:30 a.m. in Washington, and on the same day the German federal cabinet is due to take up the crypto tax bill in Berlin. Bitcoin enters the week at $82,922, Ether at $2,504, XRP at $1.40 and Solana at $109.91, according to CoinGecko early on Sunday morning. For this outlook we analysed the daily prices of the past twelve months. The most striking result: Ether and XRP sit almost exactly on their 50-day moving averages, the line at which the direction will be decided over the coming days.
Why Wednesday counts for all four coins
In the minutes of its September meeting, the US Federal Reserve let it be known that most members consider a further rate rise appropriate before the end of the year. The next meeting falls on October 27 and 28. If Wednesday’s inflation data comes in higher than expected, that rise becomes more likely, and last week that was already enough to push Ether, XRP and Solana down by between 6 and 8 percent. If it comes in lower, pressure comes off the market. For investors in Germany the cabinet adds a second date: the finance ministry’s bill concerns the taxation of crypto assets, and the details are in our piece on the tax bill. Until a law is promulgated, the one-year holding period applies unchanged.
| Coin | Price Sunday | 50-day average | 200-day average | Previous week’s range |
|---|---|---|---|---|
| Bitcoin | $82,922 | $79,989 | $75,840 | $80,652 to $86,636 |
| Ether | $2,504 | $2,501 | $2,329 | $2,414 to $2,731 |
| XRP | $1.40 | $1.40 | $1.39 | $1.33 to $1.52 |
| Solana | $109.91 | $107.44 | $98.24 | $106.41 to $121.82 |
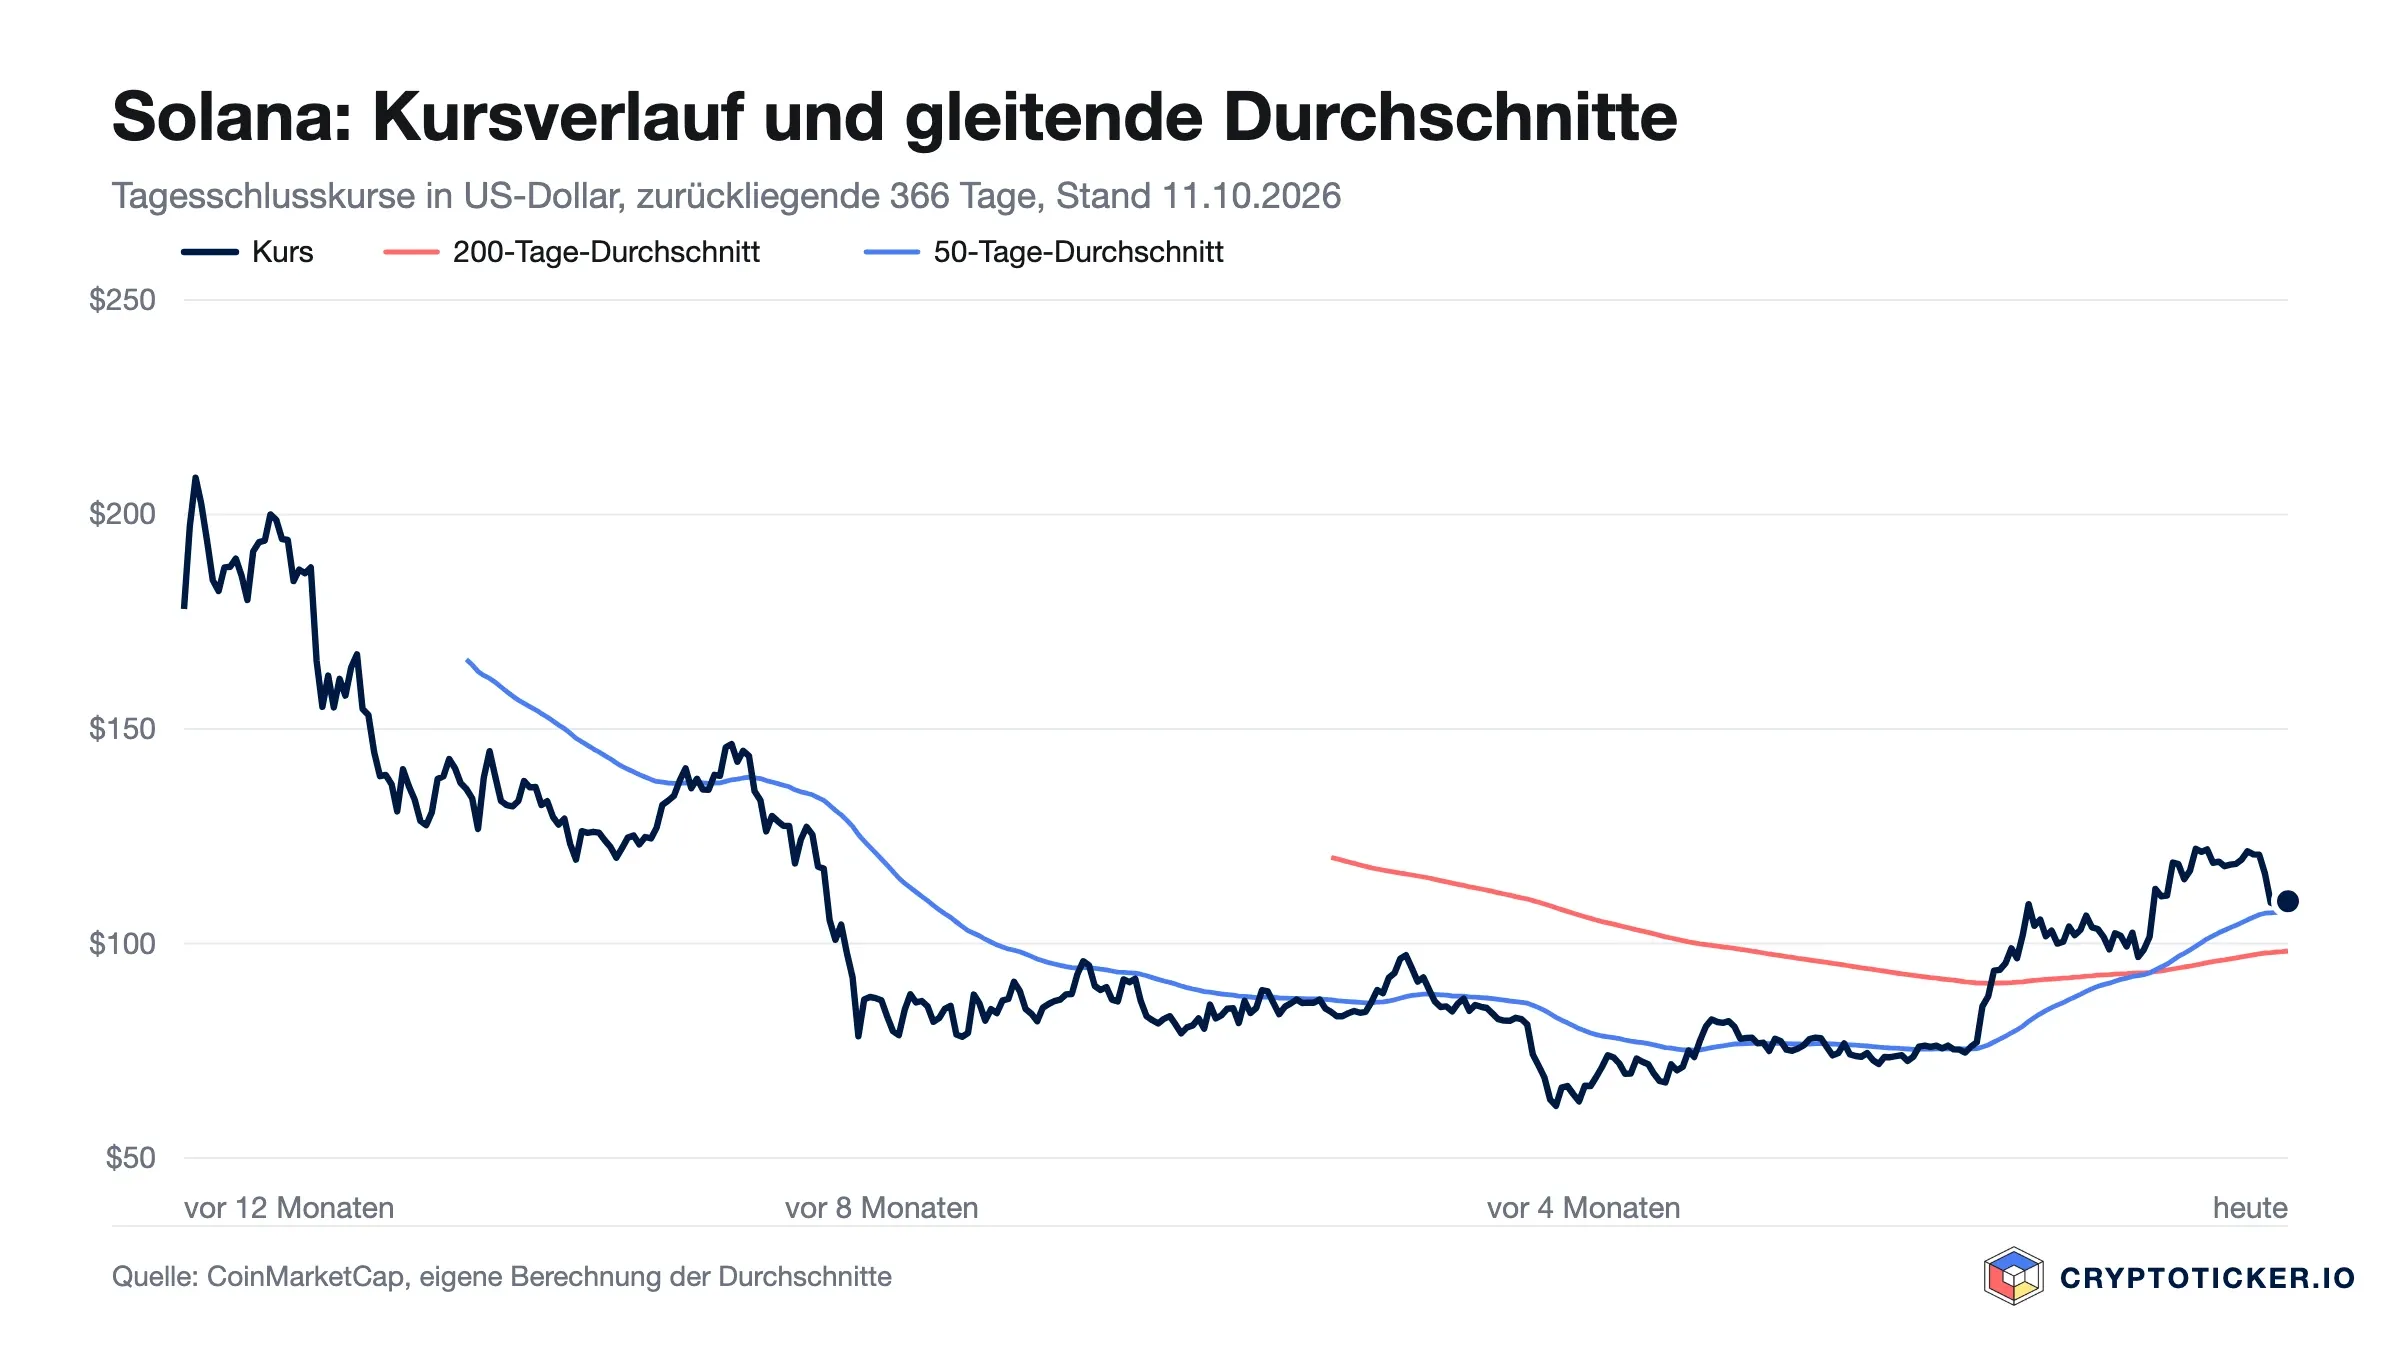
We calculated the averages from CoinMarketCap’s daily closing prices and the ranges from CoinGecko’s hourly prices between October 4 and 11. All four coins trade above their 200-day averages, so the long-term uptrend since the summer low is intact.
Bitcoin outlook for the week: $80,000 is the line
Of the four coins, Bitcoin has the largest distance to its averages. The 50-day average sits just below $80,000, almost exactly where the price turned on Thursday. If that zone holds, the weekly high of $86,636 is the obvious target to the upside. If it breaks, the next support only comes at the 200-day average around $75,800. Bitcoin options also expire in large volume on October 30, as our Bitcoin outlook on the options expiry shows. The long-term view is on our Bitcoin price prediction page.
Ethereum outlook: Ether sits exactly on the deciding line
Ether closes the week at $2,504 and therefore practically on its 50-day average of $2,501. ETF investors are working against the price: the Ether funds in the US have recorded outflows on nine consecutive trading days since September 29, as our analysis of the ETF flows shows. If Ether holds the line, the weekly high around $2,730 is the level to the upside. If the price falls below it, the weekly low at $2,414 and then the 200-day average at around $2,330 come into view. Our Ethereum price prediction supplies more background.
XRP outlook: three lines converge at $1.40
With XRP the picture is tighter still. Price, 50-day average and 200-day average all lie between $1.39 and $1.40. A constellation like this rarely lasts long; a clear move in one direction usually follows. To the downside the weekly low at $1.33 is the level, to the upside the weekly high at $1.52. What Ripple recently announced on its leveraged business is in our report on Ripple Prime, and the scenarios out to 2030 are on our XRP price prediction page.
Solana outlook: the biggest loser has the most buffer
Solana lost 8.1 percent over the week, the most among the four large coins. Even so, at $109.91 the price still stands above its 50-day average of $107.44 and a good 11 percent above its 200-day average of $98.24. Technically the network is running stronger than the price, now that blocks are produced at intervals of 200 milliseconds, as we described in our report on the Solana upgrade. The first level to the downside is the weekly low at $106.41, to the upside last Sunday’s high at $121.82. The long-term view is on our Solana price prediction page.
How to get ready for the week of the inflation data
None of these levels is a promise. They show where the market bought and sold in recent days, and with that, where a move can gather pace or stall. Three things help ahead of Wednesday. Anyone trading with leverage keeps their liquidation price away from these levels, because at 8:30 a.m. in Washington they are often reached within minutes. Anyone looking to buy more can stagger buy orders across the supports named above instead of putting everything on one price. And for anyone investing regularly, a single week changes little; a Bitcoin savings plan smooths out exactly these swings. Where to buy Bitcoin cheaply is shown by our comparison of providers.




Be the first to comment