


Welcome to this week’s publication of the Market’s Compass Crypto Sweet Sixteen Study #239. The Study tracks the technical condition of sixteen of the larger market cap cryptocurrencies. Every week the Studies will highlight the technical changes of the 16 cryptocurrencies that I track as well as highlights on noteworthy moves in individual Cryptocurrencies and Indexes. As always, paid subscribers will receive this week’s unabridged Market’s Compass Crypto Sweet Sixteen Study sent to their registered email Sundays. Past publications including the Weekly ETF Studies can be accessed by paid subscribers via The Market’s Compass Substack Blog.
An explanation of my objective Individual Technical Rankings and Sweet Sixteen Total Technical Ranking go to www.themarketscompass.com. Then go to the MC’s Technical Indicators and select “crypto sweet 16”. What follows is a Cliff Notes version* of the full explanation…
*The technical ranking system is a quantitative approach that utilizes multiple technical considerations that include but are not limited to trend, momentum, measurements of accumulation/distribution and relative strength. The TR of each individual Cryptocurrency can range from 0 to 50. The Sweet Sixteen Total Technical Ranking or “SSTTR” is the sum of the sixteen individual TRs and can be viewed as an overbought / oversold indicator as well as a confirmation / non-confirmation indicator.
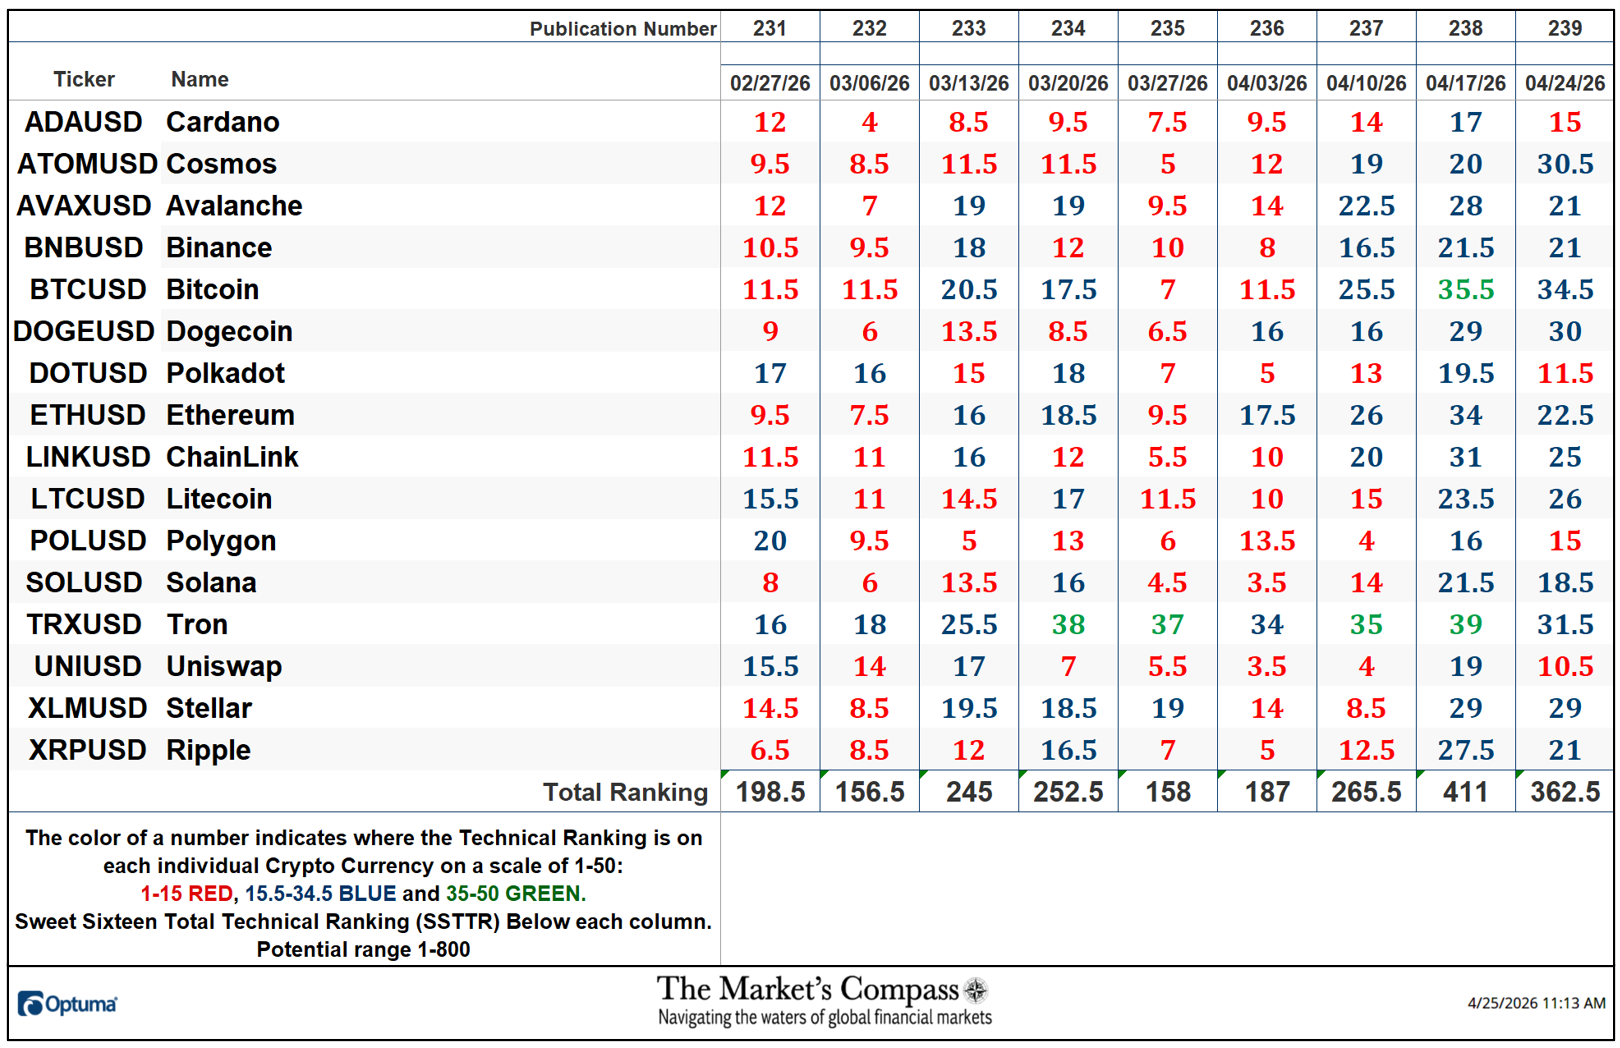
After rising sharply three weeks ago when the Sweet Sixteen Total Technical Ranking rose +41.98% to 265.5 and two weeks ago when it advanced +54.90% to 411 the “SSTTR” pulled back nominally last week, -11.80% to 362.5 which nonetheless left it well above the March 27th lows of 158.

Following a week that saw all the Sweet Sixteen Technical Rankings “TRs” rise with none of TRs ending the week in the “red zone” (TRs between 0 and 15), last week only three crypto currency TRs gained ground, one was unchanged and twelve TRs contracted leaving twelve in the “blue zone” (TRs between 15.5 and 34.5) and four fell back into the “red zone”. The Average TR loss on the week was -3.03, reversing one third of the previous week’s Average TR gain of +9.09.
The Relative Rotation Graph, commonly referred to as RRGs, was developed in 2004-2005 by Julius de Kempenaer. These charts are a unique visualization tool for relative strength analysis. Chartists can use RRGs to analyze the relative strength trends of several securities against a common benchmark, (in this case the CCi30 Index*) and against each other over any given period (in the case below, daily) over the past two weeks. The power of RRG is its ability to plot relative performance on one graph and show true rotation. All RRGs charts use four quadrants to define the four phases of a relative trend. The Optuma RRG charts rotates from Leading (in green) to Weakening (in yellow) to Lagging (in pink) to Improving (in blue) and back to Leading (in green). True rotations can be seen as securities move from one quadrant to the other over time. This is only a brief explanation of how to interpret RRG charts. To learn more, see the postscripts and links at the end of this Blog.
*The CCi30 Index is a registered trademark and was created and is maintained by an independent team of mathematicians, quants and fund managers lead by Igor Rivin. It is a rules-based index designed to objectively measure the overall growth, daily and long-term movement of the blockchain sector. It does so by indexing the 30 largest cryptocurrencies by market capitalization, excluding stable coins (more details can be found at CCi30.com).
The chart below has two weeks, or 14 days, of relative data points vs. the benchmark, deliniated by the dots or nodes. Not all of the Sweet Sixteen are plotted in this RRG Chart. I have done this for clarity purposes. Those which I believe are of higher technical interest remain.
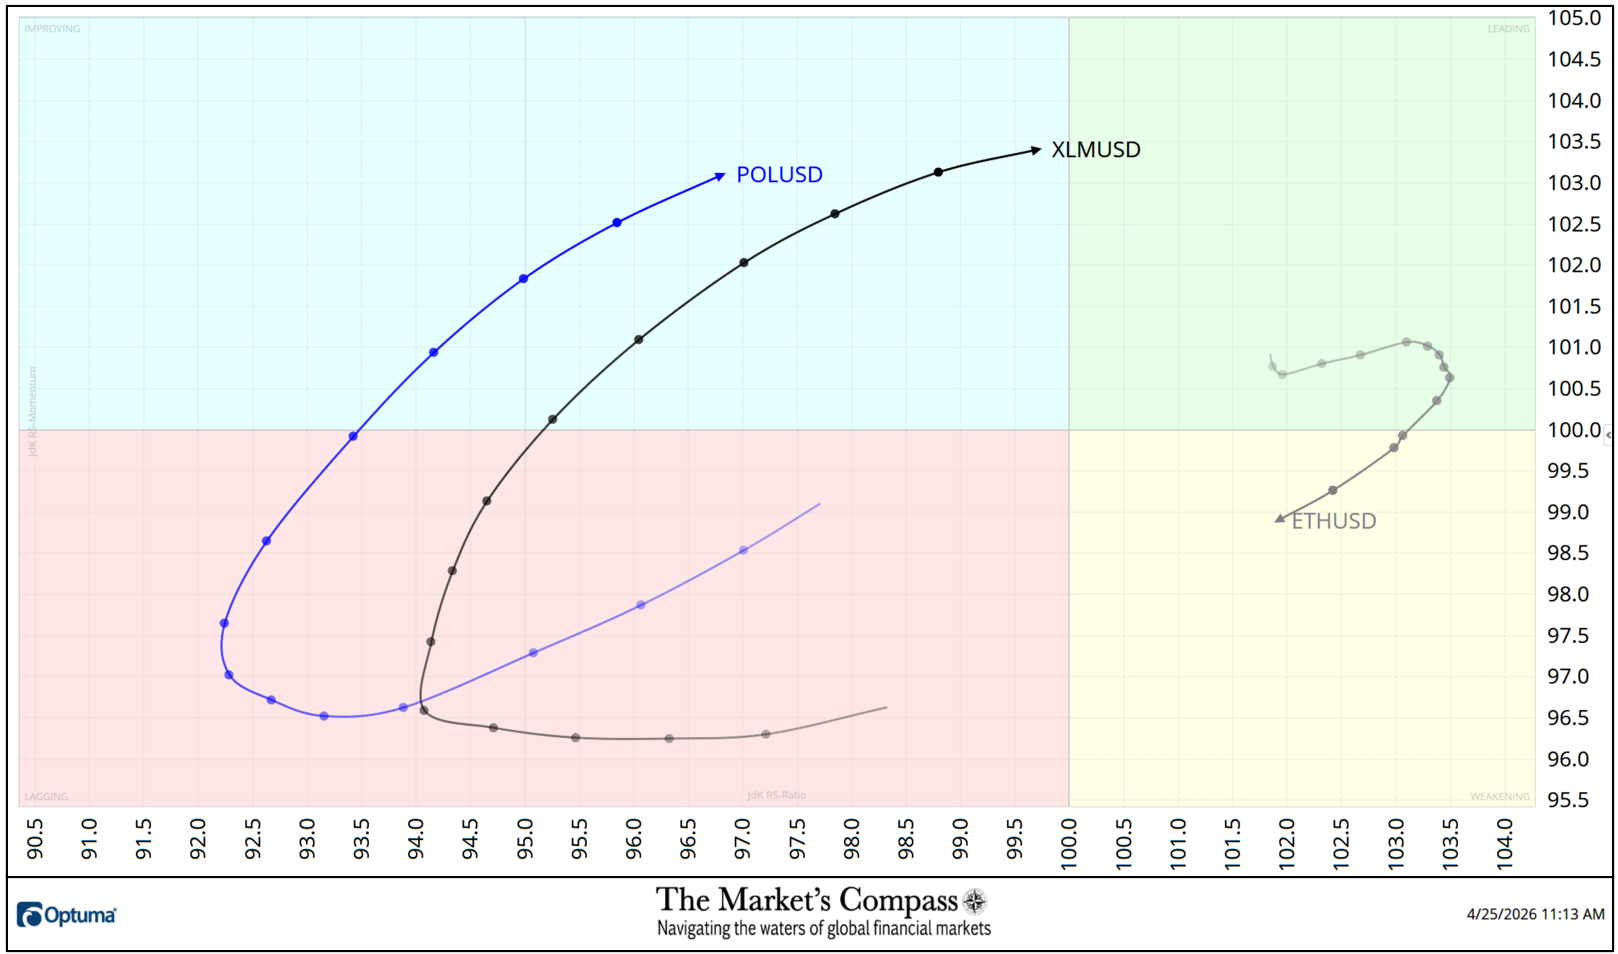
Last week, both Polygon (POL) and Stellar (XLM) moved out of the Lagging Quadrant and into the Improving Quadrant displaying elevated Relative Strength Momentum and advancing Relative Strength. Although Ethereum (ETH) began to lose a measure of upside Relative Strength Momentum last week, it still sported the best Relative Strength reading at weeks end (101.9) vs. the CCi30 Index (see the Tabulation Table below).
The “Tabulation Table” below marks the Relative Strength and Relative Strength Momentum readings of the Sweet Sixteen vs. the CCi30 Index at the end of last week and the two preceding weeks. If there has been an improvement in either the Relative Strength Ratio or the Relative Strength Momentum reading since the preceding week, I have highlighted it in green. If there has been a contraction in either it is highlighted in red and an unchanged reading in either will remain black. The color-coding system has served as a heat map over the past three weeks highlighting either the continued improvement, deterioration, or stasis vs. the benchmark CCi30 Index. The crypto currencies that are in the comments below the RRG chart are highlighted in blue.
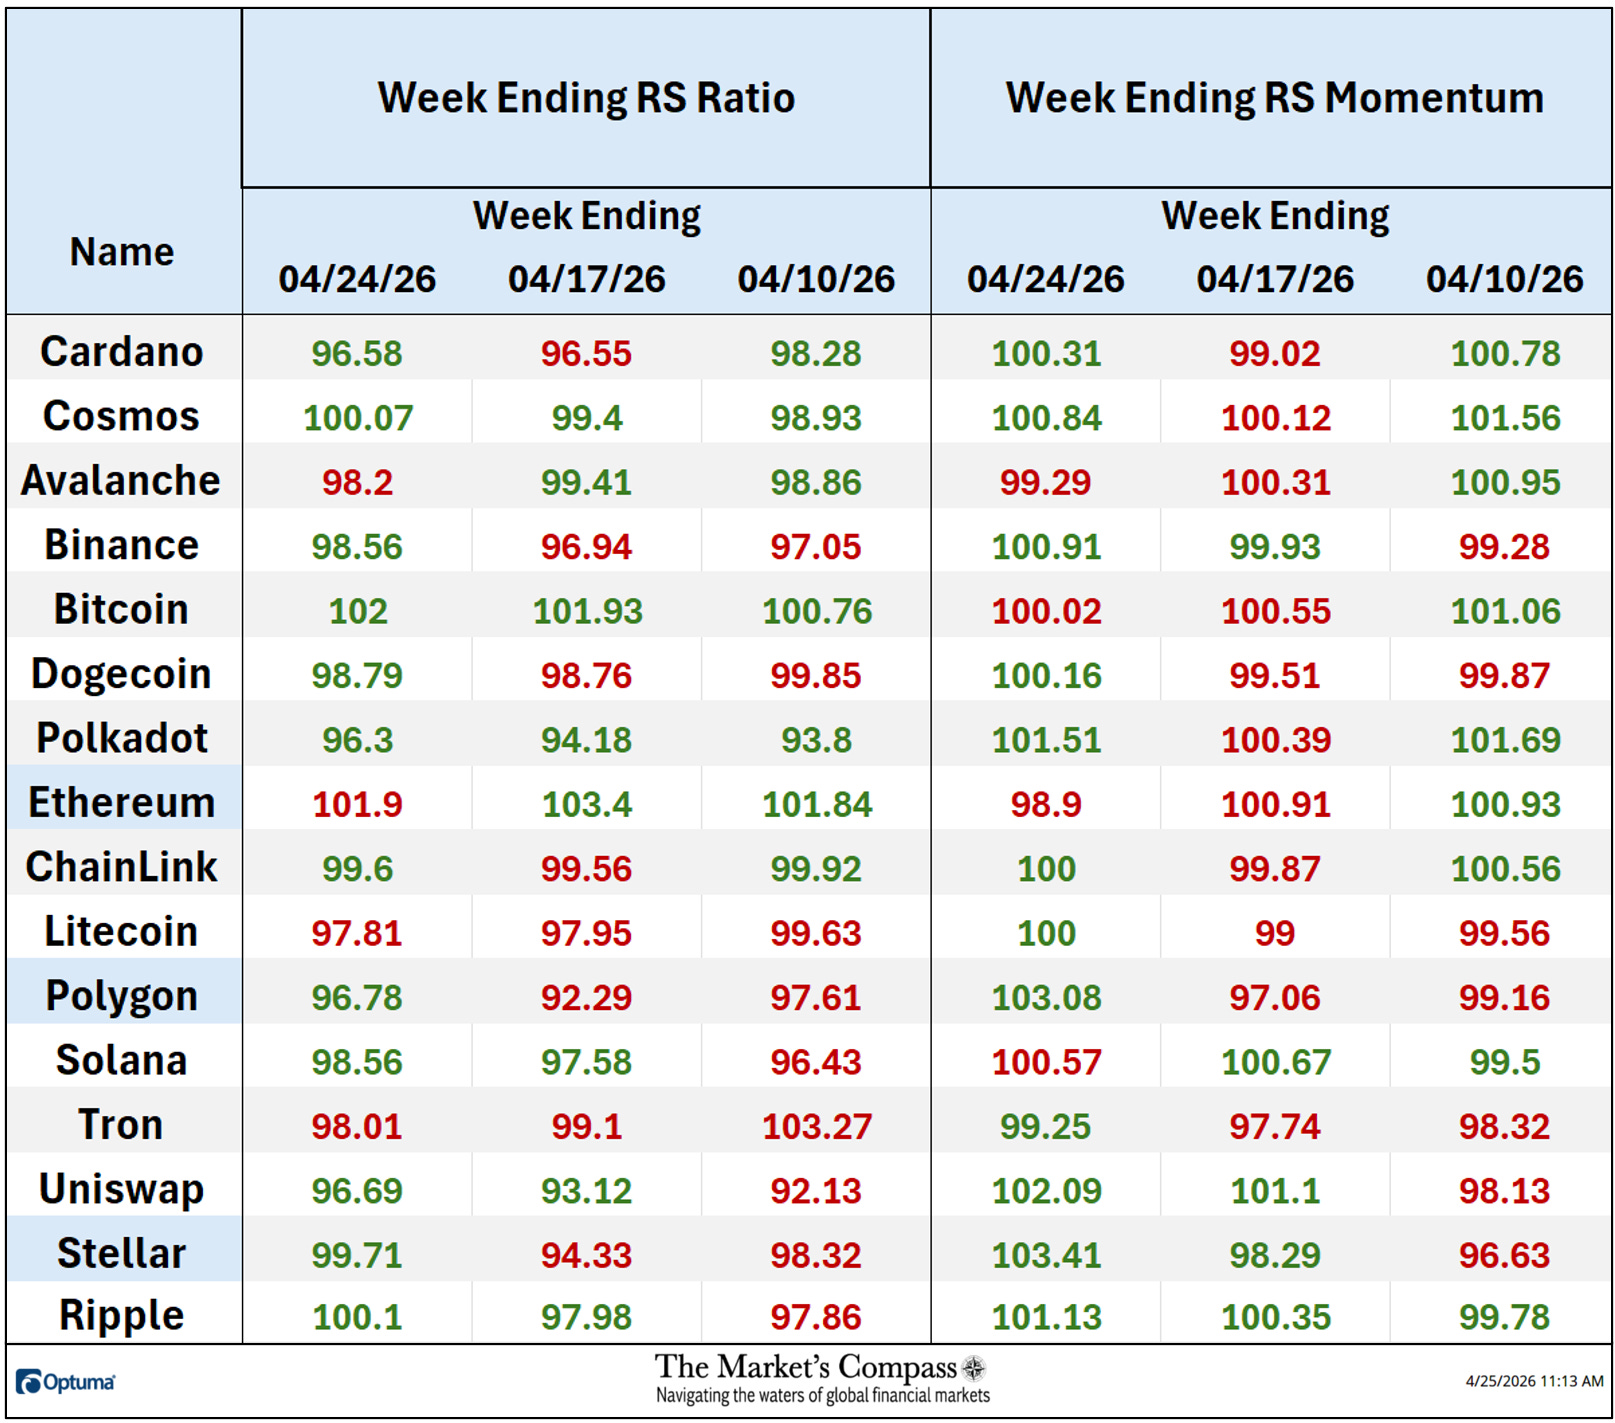
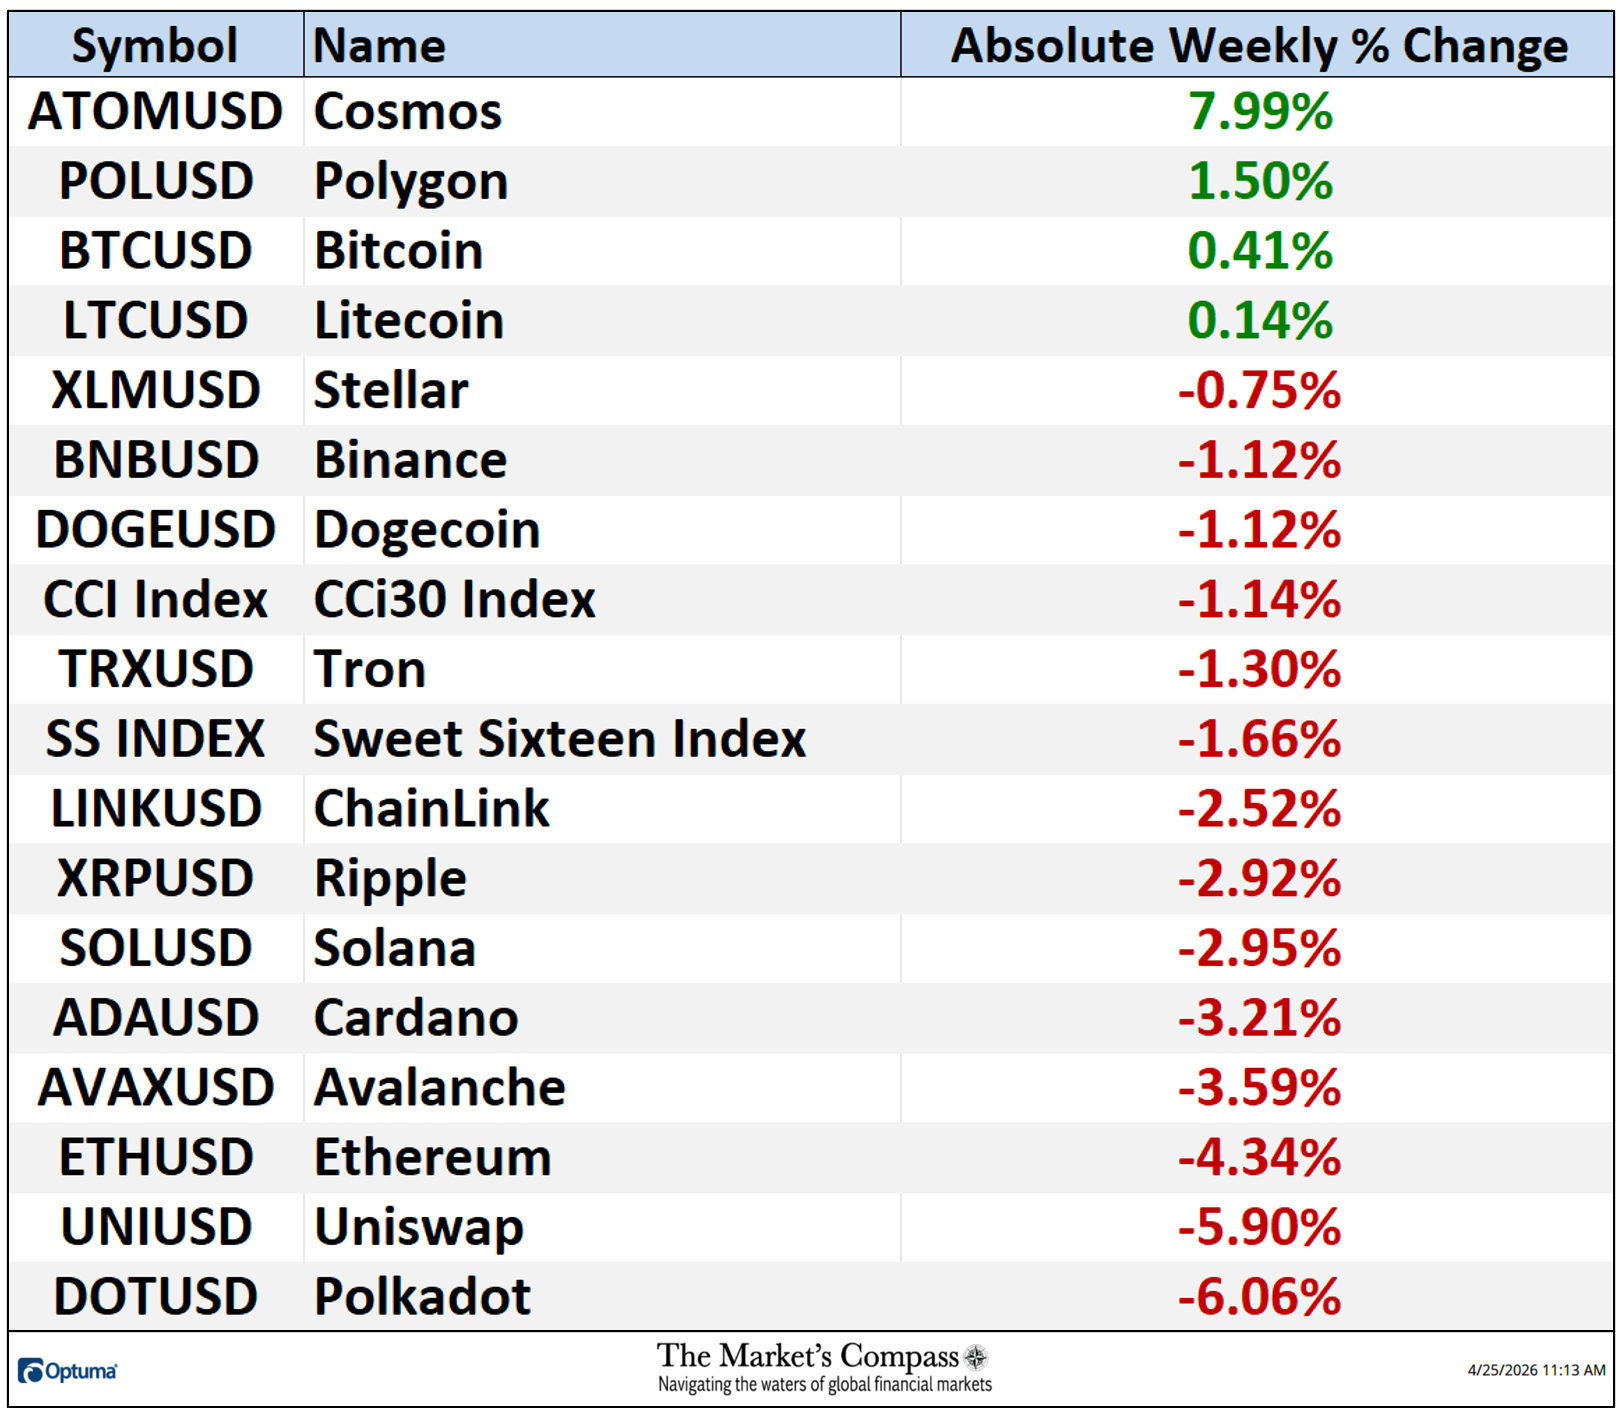
*Friday April 17th to Friday April 24th
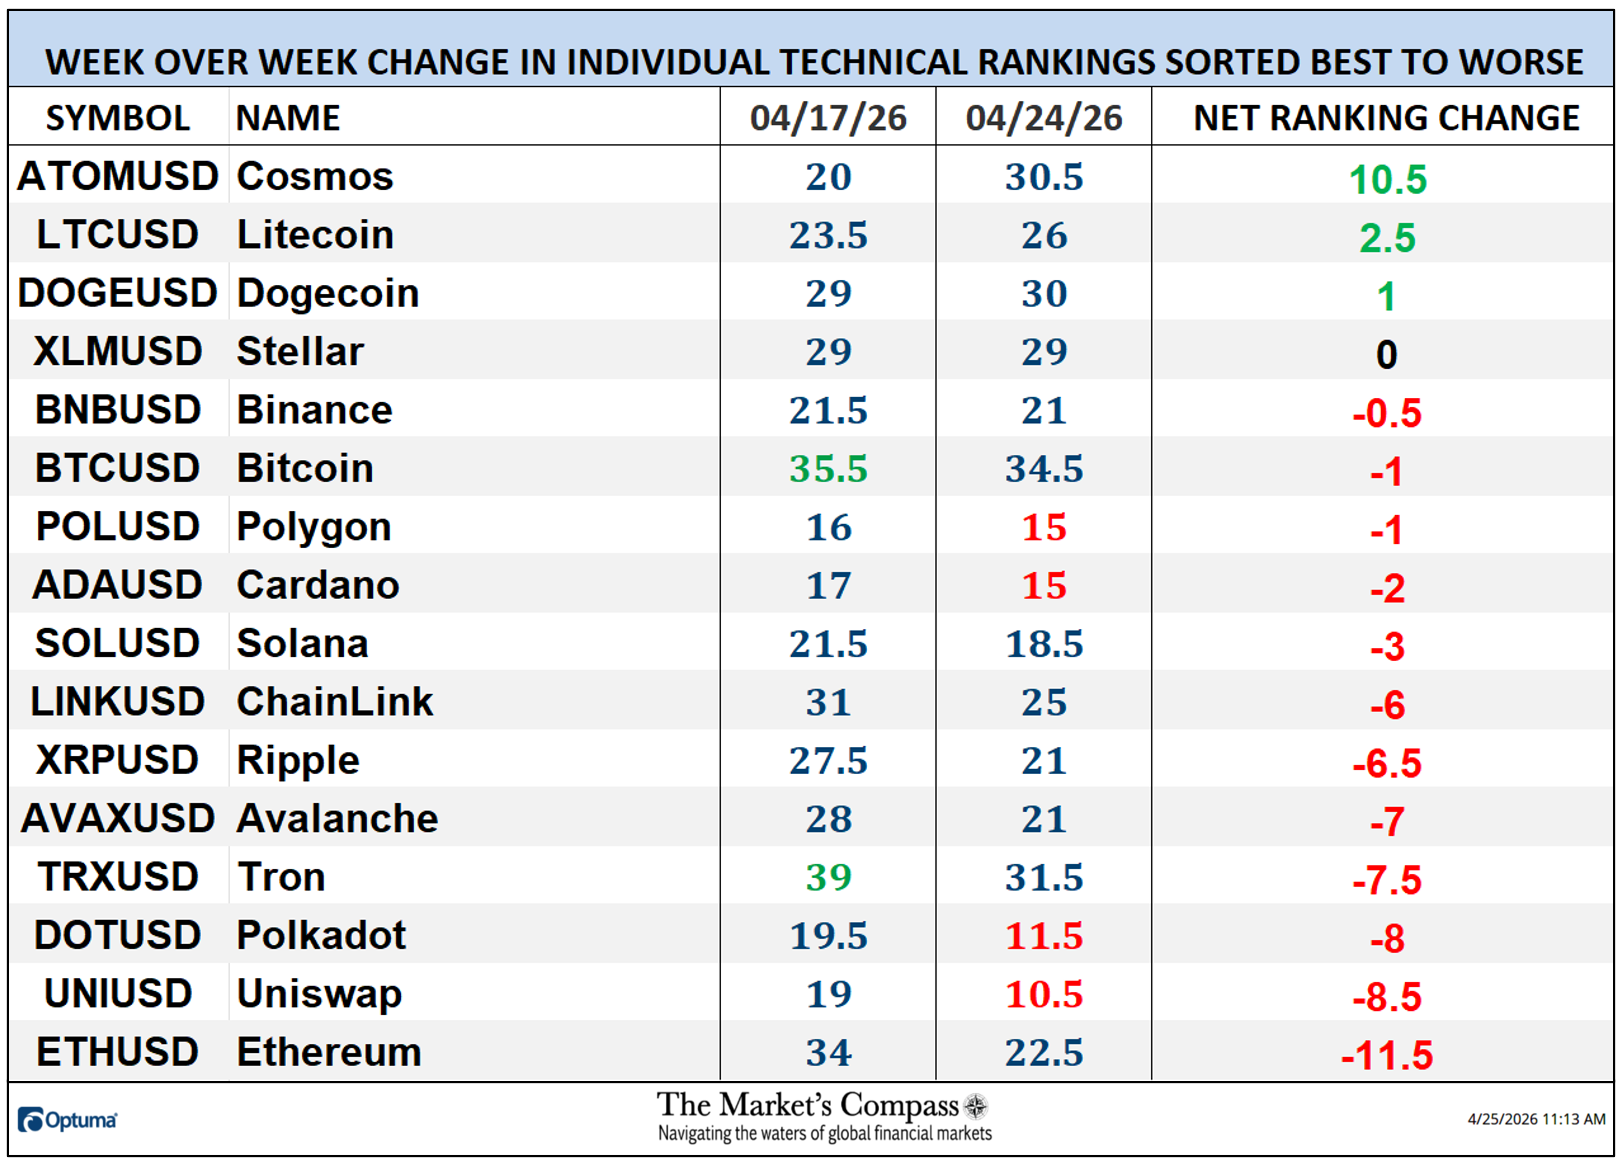
After a week when all Sweet Sixteen Crypto Currencies marked absolute price gains in confirmation of the broad-based move in the Crypto Currency Market only four registered absolute price gains and twelve lost absolute ground. Last week the average absolute percentage loss was -1.61% vs. the average percentage gain the week before of +5.49%. Both weekly average gains and losses exclude the two Indexes.
The Technical Condition Factors or TCFs are utilized in the calculation of the Individual Crypto Currencies Technical Rankings. What is shown in the excel panel below is the total TCFs of all sixteen TRs. A few TCFs carry more weight than the others, such as the Weekly Trend Factor and the Weekly Momentum Factor in compiling each individual TR of each of the 16 Cryptocurrencies. Because of that, the excel sheet below calculates each factor’s weekly reading as a percentage of the possible total.
A full explanation of my Technical Condition Factors go to www.themarketscompass.com. Then go to the MC’s Technical Indicators and select Crypto Sweet 16.
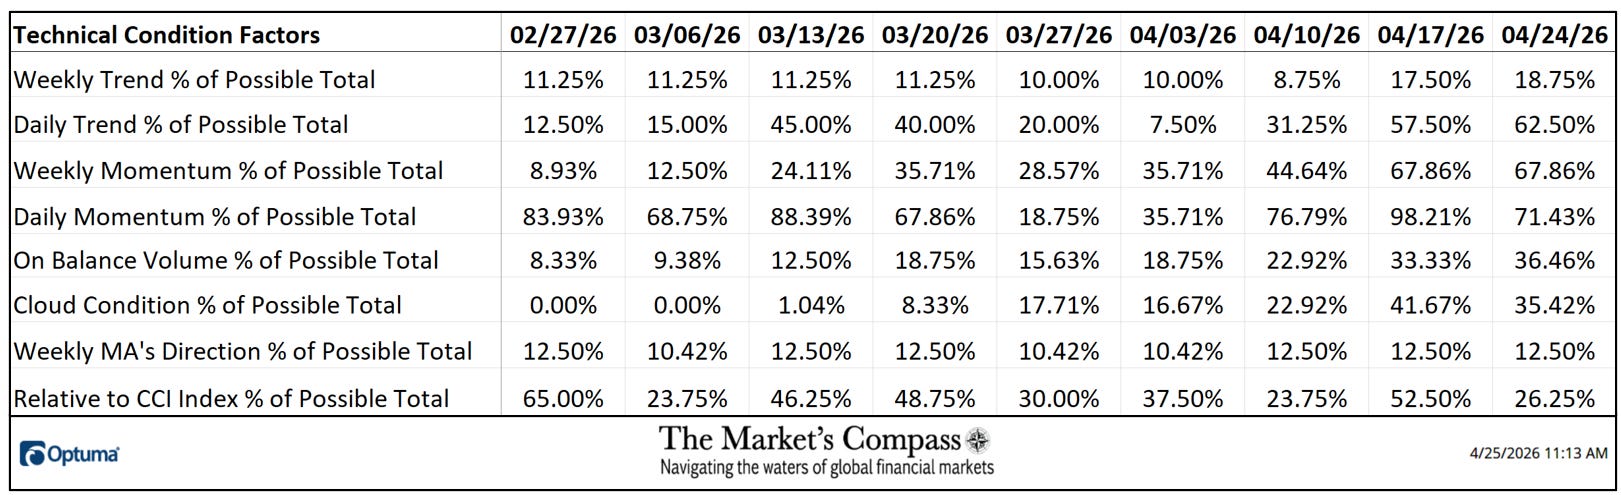
The Daily Momentum Technical Condition Factor or “DMTCF” fell back last week to 71.43% or 80 out of a possible 112 from the overbought reading two weeks ago of 98.21% or 110 out of a possible 112.
As a confirmation tool, if all eight TCFs improve on a week over week basis, more of the 16 Cryptocurrencies are improving internally on a technical basis, confirming a broader market move higher (think of an advance/decline calculation). Conversely, if more of the TCFs fall on a week over week basis, more of the “Cryptos” are deteriorating on a technical basis confirming the broader market move lower. Last week three TCFs moved higher, two were unchanged and three moved lower.
The “TSSTCF” Oscillator tallies the eight objective Technical Condition Factors into one overbought / oversold indicator that ranges between 0 and 8.
The CCi30 Index held price support at the 10,200 level and support at the overtaken Tekan Plot (red line) last week. Short-term price momentum continues to improve as witnessed by the Stochastic Momentum Index which continues to rise above its signal line. Longer-term MACD is climbing above its signal but remains deep in negative territory. The Total Technical Condition Crypto Factor (bottom panel) pulled back slightly last week but remains above both its moving averages.

The shorter-term Daily Chart with momentum oscillators of the CCi30 Index reveals a few positive technical features despite the fact it remains trapped in the nearly three-month trading range (highlighted with the yellow box). Prices held support at the Kijun Plot (green line) and the Cloud model last Monday. MACD continues to gently rise in positive territory above its signal line and after pulling back from near overbought territory the Stochastic Momentum Index has turned up (center panel). The one concerning feature is the Sweet Sixteen Daily Momentum / Breadth Oscillator has turned at a lower high, and is back below its shorter-term moving average.
Key to the base-building technical thesis is that prices hold the rising trend line and the 9,810 level.
For readers who are unfamiliar with the technical terms or tools referred to in the comments on the technical condition of the CCi30 Index can avail themselves of a brief tutorial titled, Tools of Technical Analysis available on my website.
Charts are courtesy of Optuma whose charting software allows the Technical Rankings to be calculated and back tested.
To receive a 30-day trial of Optuma charting software go to…

Be the first to comment