




All news is rigorously fact-checked and reviewed by leading blockchain experts and seasoned industry insiders.
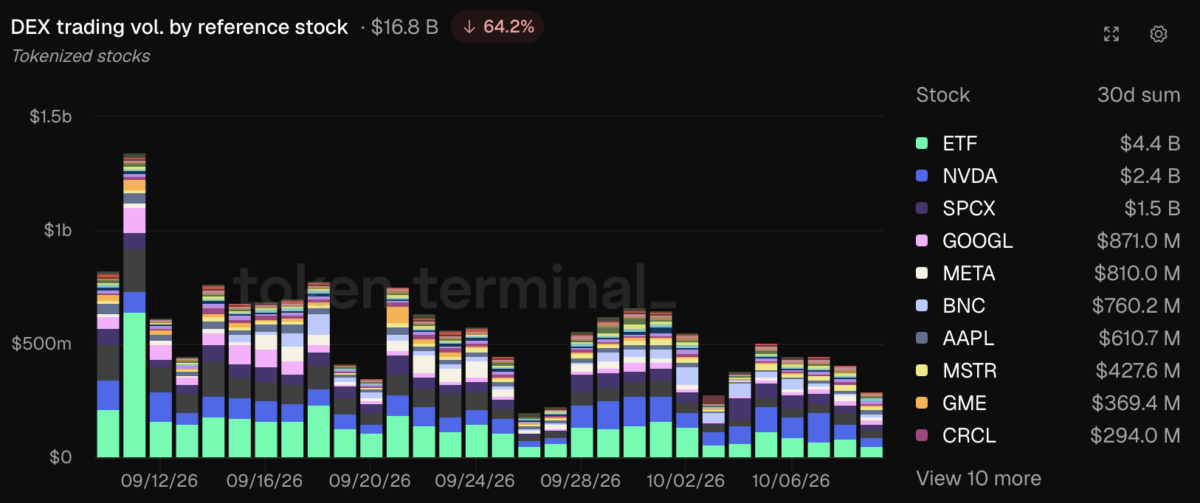
- Tokenized stock DEX trading volume fell 64.2% over 30 days, reaching $16.8 billion.
- Market capitalization rose to $3.8 billion, while the sector expanded across 35 issuers and 18 blockchains.
- ETF-linked instruments accounted for 26.1% of trading, highlighting demand concentrated in familiar financial exposures.
Tokenized stocks are gaining market value while generating substantially less trading activity, according to data from Token Terminal.
The sector’s market capitalization reached $3.8 billion, up 18.6% over 30 days, even as decentralized exchange (DEX) volume contracted to $16.8 billion.
The divergence raises a question for the emerging market: whether growing tokenized equity valuations are being matched by sustainable secondary-market liquidity.
The dashboard also shows approximately five million holders and 11,811 listed instruments, although those figures do not establish how many investors actively traded during the reporting period.

Trading Activity Contracts Faster Than Market Value Grows
The 64.2% decline implies that tokenized stock DEX volume stood near $46.9 billion during the preceding comparable period.
In absolute terms, trading activity fell by approximately $30.1 billion.
The magnitude of that contraction is notable because it occurred alongside an increase in the reported value of tokenized equities.
One way to examine the relationship is through a simple volume-to-market-capitalization comparison.
The latest 30-day trading volume was approximately 4.4 times the sector’s reported market capitalization.
That ratio provides a rough indication of trading intensity, but it is not a conventional turnover measure. The volume figure covers a 30-day period, while market capitalization is a point-in-time valuation.
It also cannot establish whether the same tokens were traded repeatedly or how much activity involved market makers.
A proper liquidity assessment would require additional information, including order-book depth, bid-ask spreads and transaction costs.
Those measures are particularly relevant for tokenized equities because trading volume can remain high even when executing larger orders is difficult or expensive.
ETFs and Nvidia Dominate Tokenized Stock Trading
Trading activity is concentrated in a relatively small group of reference assets.
Token Terminal’s 30-day data identify ETF-linked exposure as the largest category, accounting for $4.4 billion in DEX volume.
Nvidia followed with $2.4 billion, while SPCX-related instruments generated approximately $1.5 billion.
The five leading reference categories were:
- ETFs: $4.4 billion, representing 26.1% of total volume.
- Nvidia: $2.4 billion, or 14.5%.
- SPCX: $1.5 billion, accounting for 9.1%.
- Alphabet: $871 million, representing 5.2%.
- Meta: $810 million, or 4.8%.
Together, these categories accounted for approximately 59.7% of reported activity.
This concentration matters for market structure.
Although the dashboard lists thousands of tokenized instruments, most trading is associated with a comparatively narrow selection of recognizable securities and investment products.
That creates a distinction between the breadth of available listings and the depth of trading demand.
An expanding token catalog does not necessarily mean liquidity is distributed across those instruments.
Nasdaq-100 Exposure Leads Individual Token Rankings
The asset-level data offer a different perspective on where trading occurs.
QQQb, a tokenized instrument associated with Nasdaq-100 exposure, generated approximately $2.3 billion in decentralized trading volume over the reporting period.
It represented 13.5% of the tracked market.
A tokenized Nvidia product followed with $1.4 billion, while SPY-related exposure recorded approximately $828.2 million.
These figures should not be combined directly with the reference-stock rankings.
Token Terminal’s reference-stock view groups trading by the underlying financial exposure. Its asset view measures individual tokenized instruments.
For example, the $4.4 billion attributed to ETF-linked reference assets represents activity across that category, not the turnover of a single ETF token.
This distinction is useful when evaluating market concentration. A reference asset may appear highly liquid in aggregate even when trading is fragmented among several tokenized versions.
Investors assessing a specific instrument therefore need product-level liquidity data rather than relying exclusively on aggregate activity associated with its underlying security.
Broader RWA Assets Under Management Reach $32 Billion
The tokenized equity figures sit within a larger market for blockchain-based real-world assets.
At the time of writing DefiLlama’s dashboard reports approximately $32.05 billion in total active real-world asset assets under management.
The accompanying chart shows an upward trend, interrupted by a temporary pullback before the latest recovery.
However, the DefiLlama and Token Terminal figures measure different things.
The broader RWA category includes assets beyond tokenized stocks, such as government securities, credit instruments and investment funds.
DefiLlama’s active AUM figure therefore should not be interpreted as the value of tokenized equities or added to the sector’s reported market capitalization.
Likewise, growth in RWA assets under management does not establish that those assets are actively changing hands on decentralized exchanges.
The distinction is particularly relevant as institutional tokenization increasingly encompasses products designed for holding and settlement rather than frequent secondary-market trading.
The Next Test Is Liquidity, Not Listings
The latest data suggest that tokenized equity adoption cannot be assessed through market capitalization alone.
The sector now spans 35 issuers and 18 blockchains, but the available figures do not reveal how much liquidity is accessible across those networks or how efficiently investors can trade between them.
A fragmented market may support a large number of instruments while concentrating meaningful trading activity in only a handful.
The reported contraction could reflect reduced speculative turnover, migration toward other trading venues or normalization following an earlier period of elevated activity. The dashboard does not identify a definitive cause.
For investors, three indicators would provide a stronger assessment of market development: trading volume relative to outstanding token supply, execution costs for meaningful order sizes, and the distribution of liquidity across individual instruments.
Until those measures are considered alongside market capitalization, growth in tokenized asset valuations should not be mistaken for an equivalent improvement in market liquidity.



Be the first to comment