


Uniswap price has held above the $3 level after a sharp three-day rally driven by Standard Chartered’s bullish coverage and a wave of short liquidations across derivatives markets.
Summary
- Uniswap price held above $3 after Standard Chartered’s $100 price target triggered a sharp rally.
- CoinGlass data shows major liquidation clusters between $3.30 and $3.85 that could fuel volatility.
- Bulls must defend the $2.93 support zone as hawkish Fed policy continues to pressure risk assets.
According to data from crypto.news, Uniswap (UNI) price traded around $3.03 on June 22, roughly 20% above its June 15 levels despite retreating from a local high near $4 reached earlier in the week.

Market sentiment improved after Standard Chartered initiated coverage of the decentralized exchange token on June 15 and projected a long-term price target of $100 by 2030, drawing renewed attention to DeFi assets after months of underperformance.
The banking giant’s forecast arrived as UNI was trading near multi-month lows below $2.50. Fresh spot demand quickly pushed the token through several overhead resistance levels and triggered a rapid repricing across futures markets.
According to CoinGlass data, UNI futures volume surged while open interest climbed sharply during the advance, highlighting aggressive positioning from traders attempting to capture the breakout.
As crypto.news previously reported, Standard Chartered analyst Geoffrey Kendrick argued that Uniswap remains one of the strongest beneficiaries of growing decentralized exchange activity and could capture a larger share of on-chain trading volumes over the coming years.
“We initiate coverage of Uniswap with a UNI-USD price forecast of USD 100 by end-2030, a 40x increase from today’s USD 2.50 level.”
Uniswap price faces major liquidation cluster above $3.30
CoinGlass liquidation data shows several large leverage concentrations sitting above the current market price. The most significant cluster remains between $3.30 and $3.45, while another dense pocket of short liquidations is visible near $3.75-$3.85.
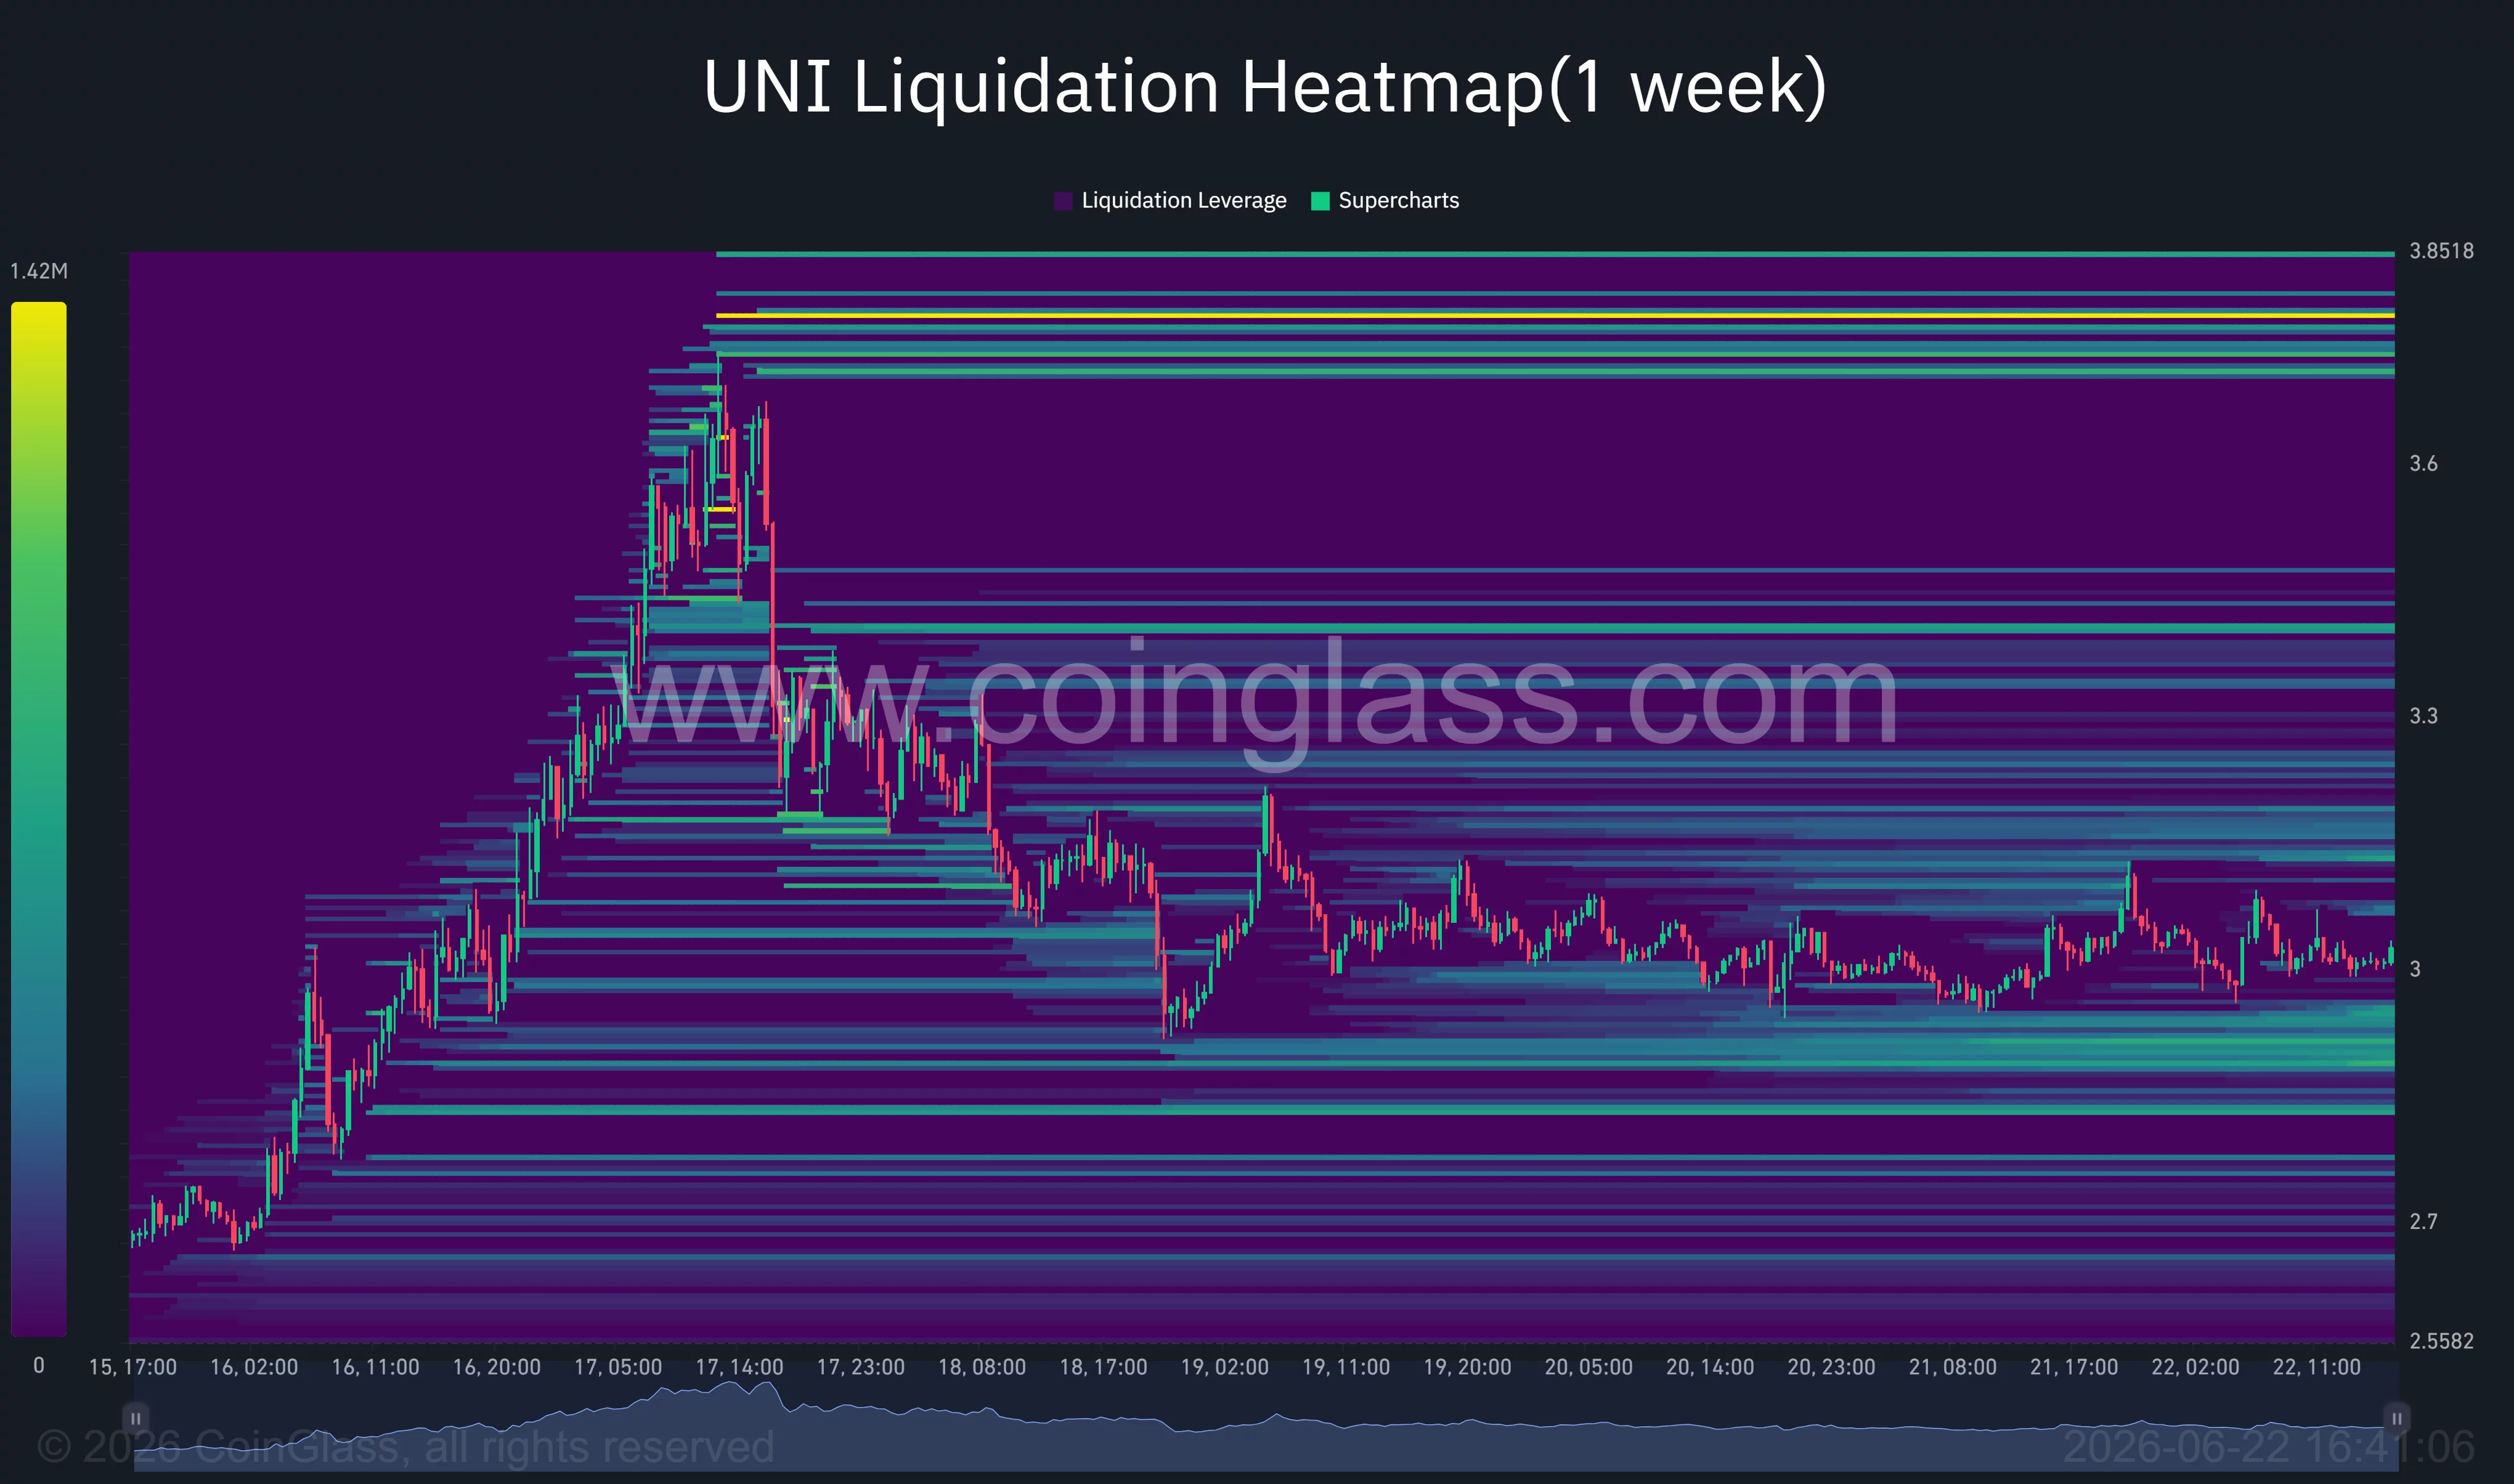
A move into those zones could force additional short covering and create another burst of volatility similar to the squeeze witnessed between June 15 and June 17.
Daily chart structure also improved after UNI reclaimed the Murrey Math support zone around $2.93. The token now trades just below the key pivot level at $3.125. A successful break above that area would expose resistance levels at $3.32, $3.51, and $3.71.
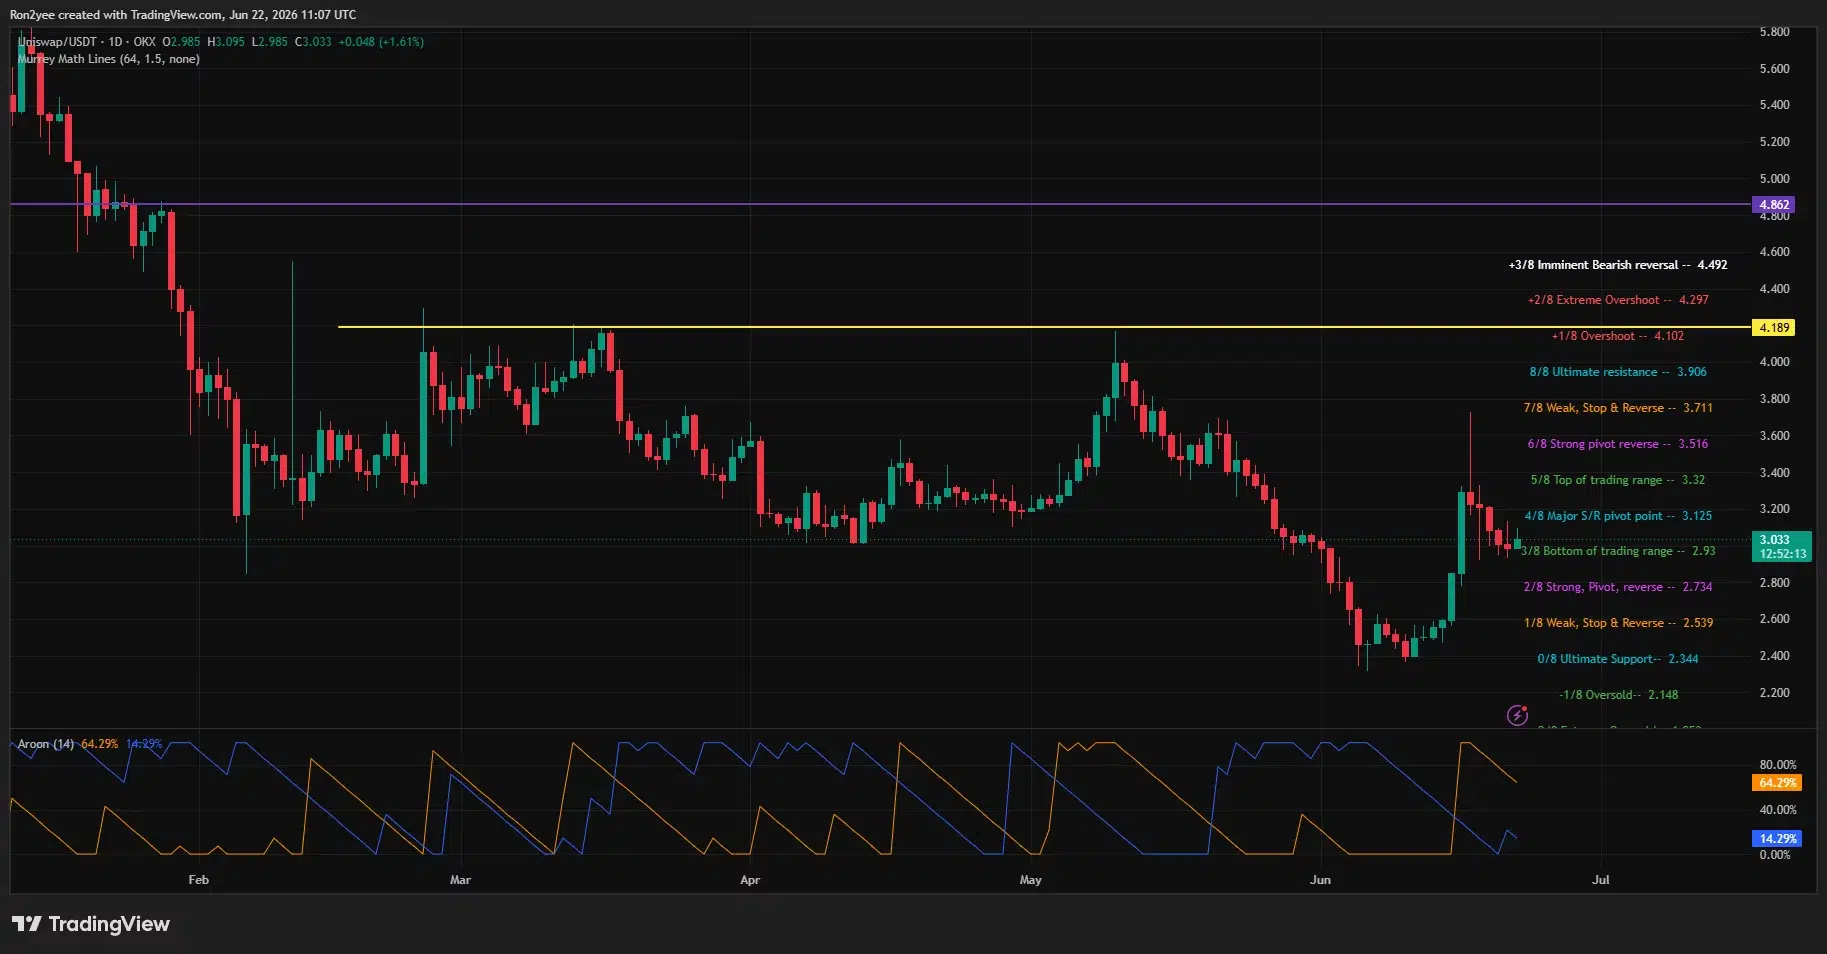
Beyond those levels, the next major overhead barrier sits near $3.90, which coincides with the strongest liquidation concentration visible on the one-week heatmap.
Momentum indicators remain constructive despite the pullback. The Aroon Up indicator remains elevated above 60%, suggesting buyers continue to control the dominant trend even after several days of consolidation around the $3 mark.
Uniswap price risks deeper pullback if $2.93 support fails
Profit-taking emerged shortly after the rally as traders locked in gains from the rapid advance. At the same time, risk appetite across digital assets weakened following the Federal Reserve’s latest policy decision under Chair Kevin Warsh, which reinforced expectations that interest rates could remain restrictive for longer than previously anticipated.
Technical downside risks remain concentrated around the $2.93 support zone. Losing that level would place the $2.73 pivot and the $2.54 support area back into focus. The liquidation heatmap also shows relatively thin leverage positioning beneath current prices, reducing the likelihood of a large liquidation-driven rebound if support fails.
For now, UNI continues to trade above the level that capped prices throughout most of June. As long as buyers defend the newly reclaimed $2.93-$3.00 range, traders are likely to keep watching the dense liquidation pockets above $3.30 for the next directional move.
Disclosure: This article does not represent investment advice. The content and materials featured on this page are for educational purposes only.

Be the first to comment