


What to know:
- UNI Derivatives surge as open interest rises 14.79% and trading volume jumps over 214%, reflecting higher participation.
- Technical setup shows potential breakout as UNI holds support, and a rising trendline signals buyer control.
- Analysts project 50% upside toward $6 if UNI breaks resistance, supported by tightening Bollinger Bands and neutral RSI.

Uniswap (UNI) is moving in a positive price trajectory, with the reversal in sight as the token broke above the trendline resistance. According to CoinMarketCap, UNI is currently trading at $3.32, with a 24-hour trading volume of $286.48 million and a market capitalization of $2.11 billion. Its price has surged by 2.33% over the last 24 hours and 3.39% over the last week.


Source: CoinMarketCap
UNI Derivative Data Point to Upside Potential
According to Coinglass, the UNI open interest rose 14.79% to $210.38 million, while trading volume increased 214.40%, reaching $381.45 million, reflecting strong market participation, rising liquidity, and heightened trading activity across derivatives markets with sustained momentum and growing investor engagement.

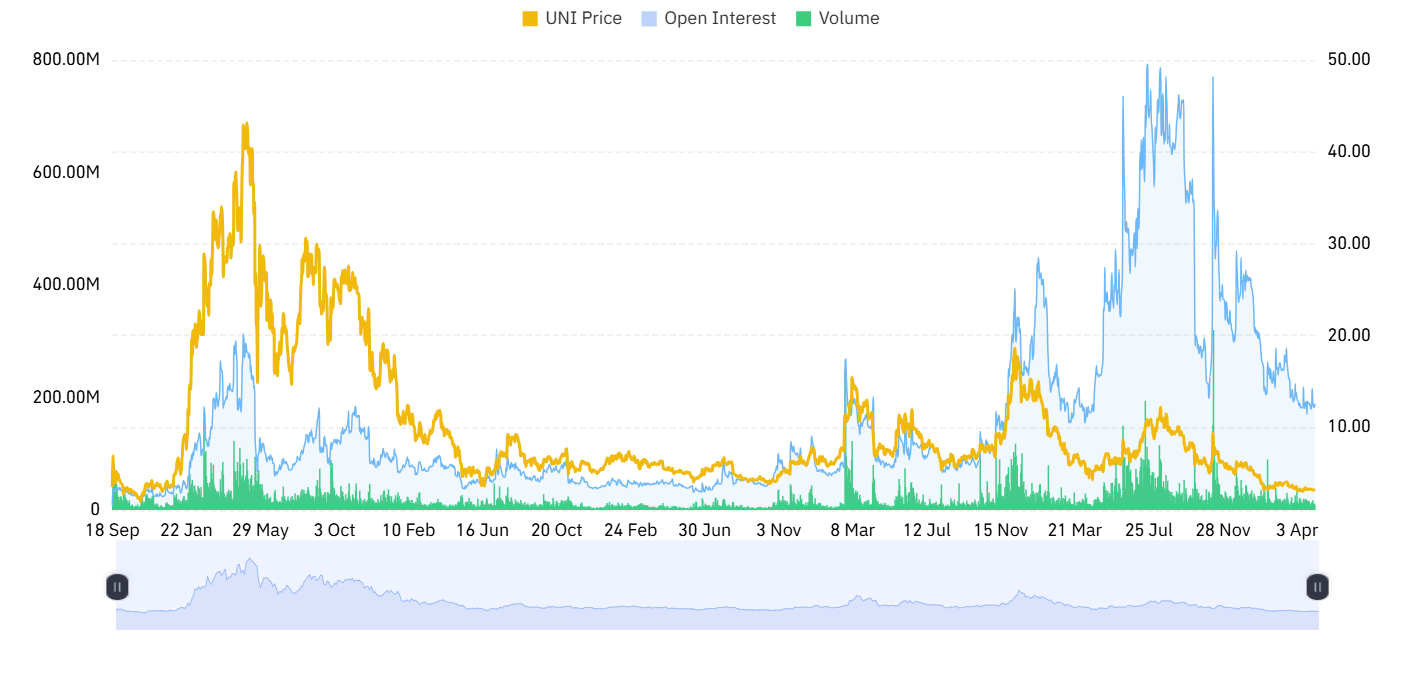

Source: Coinglass
However, the OI-weighted rate stands at 0.0016%, indicating a very low funding bias and neutral leverage conditions, suggesting balanced long and short positioning with limited cost pressure and stable derivatives sentiment across the market.

Source: Coinglass
Also Read: Western Union Debuts Promising SOL-Based Stablecoin USDPT This May 2026
UNI Price Action Signals Possible 50% Surge
Furthermore, the crypto analyst World Of Charts revealed that UNI is showing strong technical structure as price holds above a rising trendline and a key horizontal support zone.
This confluence suggests buyers are defending demand levels while selling pressure weakens. The setup indicates a constructive consolidation phase, often preceding expansion moves when market momentum begins to shift upward again.

Source: TradingView
Following the continuation of upward momentum, UNI is likely to trigger a breakout movement to the $6 level, suggesting a possibility of more than 50% gains from the present level.
The move is expected after breaking out above the resistance level, which, if sustained, will drive the momentum higher in the coming periods.
Technical Indicators Show Signs of Stabilization
According to TradingView, the UNI is transitioning from a rapid fall to a stable phase. The UNI price, which fell from its February high of $5.50, formed a support at the $3.00 level. Currently trading at $3.31, the token is approaching the 20-day simple moving average (SMA).
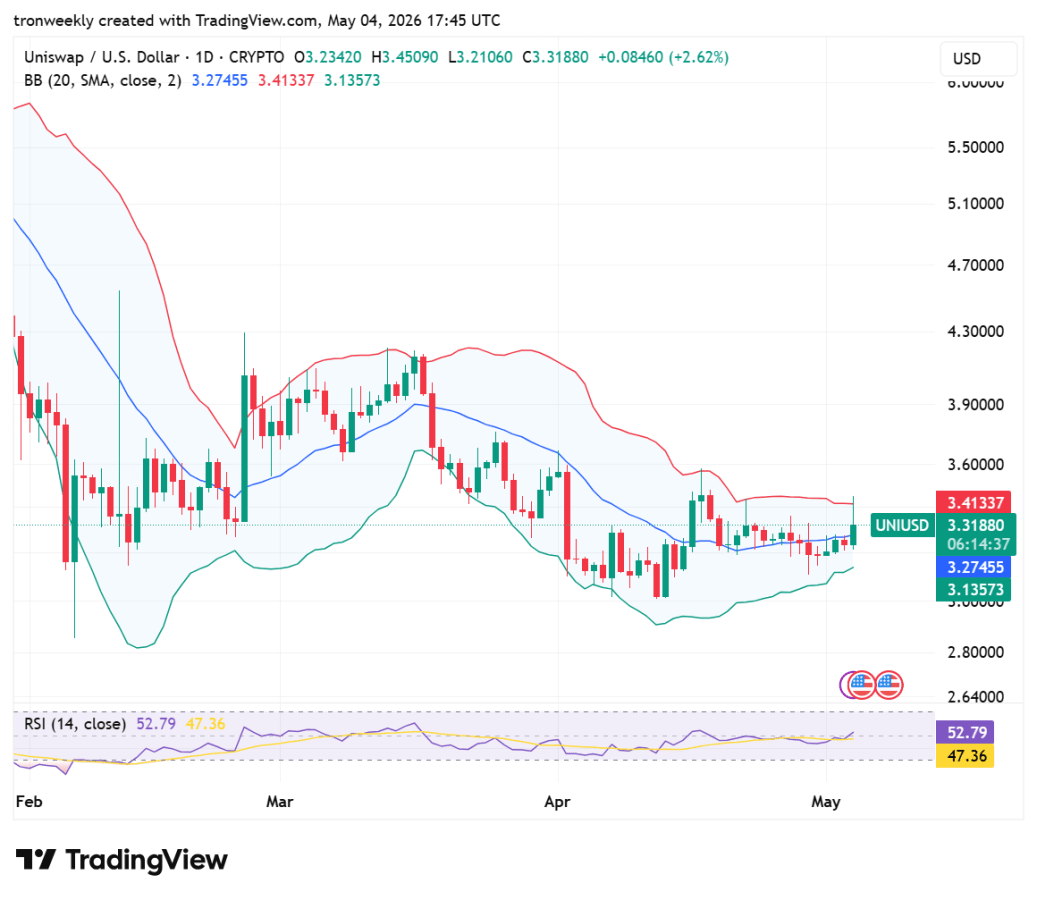
Source: TradingView
Indicators suggest that the volatility swing could be near. There is compression on the Bollinger Bands, as there is resistance at $3.41 and support at $3.13.
The RSI indicator remains comfortably at 52.79, with no obvious trend emerging on the chart. A breakout above the upper band will be required for the uptrend to be confirmed.
This article contains market analysis and price predictions. These are not guarantees. Crypto markets are volatile. Always DYOR. Not financial advice.
Also Read: Uniswap (UNI) Tests Key Support Zone as Bearish Structure Targets $4.20 Recovery Levels

Be the first to comment