


What to know:
- VET breakout above a long-term descending trendline signals weakening bearish pressure and rising bullish interest.
- The next key resistance zone is crucial, and a breakout could push VeChain toward the $0.02 target.
- Bollinger Bands and MACD show consolidation, suggesting buildup before the next major move.

VeChain (VET) is moving in a neutral price setup as the general trend in the crypto market has cooled after the recent rally. According to CoinMarketCap, as of Sunday, April 19, the VET price has shown stability over the last 24 hours, but it remains up by 4.95% over the last week.
At the time of writing, VET is trading at $0.007167, with a trading volume of $19.13 million, which has declined by 25.07% over the last 24 hours. However, its market capitalization stands at $1.06 billion, which is also down by 8.08%.

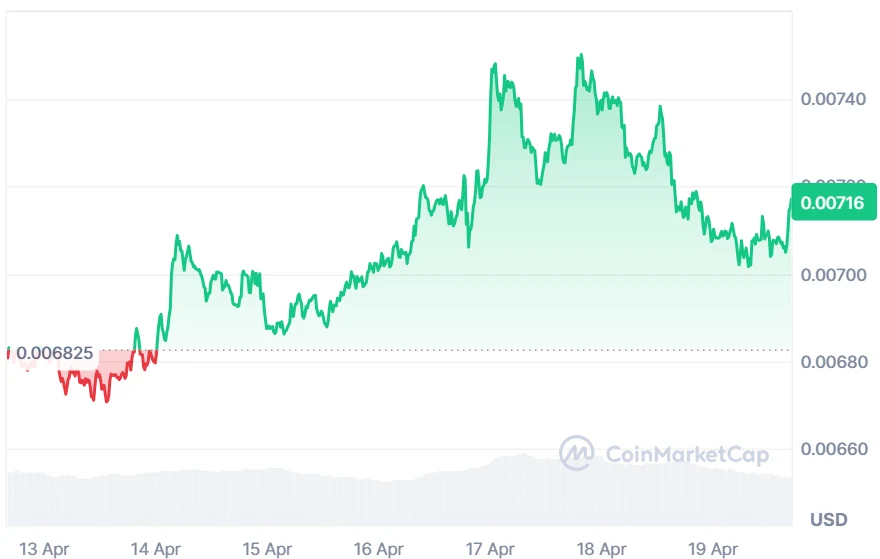
Source: CoinMarketCap

Also Read: VeChain (VET) Eyes $0.02 Rally After Descending Trendline Breakout
VET Breakout Signals Potential Rally to $0.02
Furthermore, the crypto analyst World Of Charts pointed out that VET is showing early signs of a bullish shift after successfully breaking above a long-standing descending trendline, a level that had capped price action for months.
This breakout suggests weakening bearish control and growing buyer interest, with traders now watching whether momentum can sustain and build toward a broader trend reversal.

Source: World Of Charts’ X Post
The following crucial barrier lies within an essential horizontal resistance zone, which has constantly resisted any price increases.
If the token manages to break this barrier, the experts suggest that there is a possibility of an uptrend towards the $0.02 region. However, failing to pass through this resistance, there might be a period of consolidation for prices in the coming days.
Technical Indicators Point to a Consolidation Phase
According to TradingView, VET enters a period of consolidation from March to April 2026. The price range is contained within its Bollinger Bands and is confined between the resistance level of $0.00740 and the support level of $0.00671. This is an indication of consolidation, as it signifies that the market is indecisive.

Source: TradingView
Similarly, the MACD remains in the stagnant market environment, with its signal lines closely packed around the zero line, and the histogram making very little movement.
The compression on the graph indicates minimal volatility in the market without any definite direction. The traders are most likely expecting some trigger that would lead to a breakout from this tight range.
This article contains market analysis and price predictions. These are not guarantees. Crypto markets are volatile. Always DYOR. Not financial advice.
Also Read: VeChain (VET) Descending Channel Pattern Hints at Potential Breakout to $0.16

Be the first to comment