


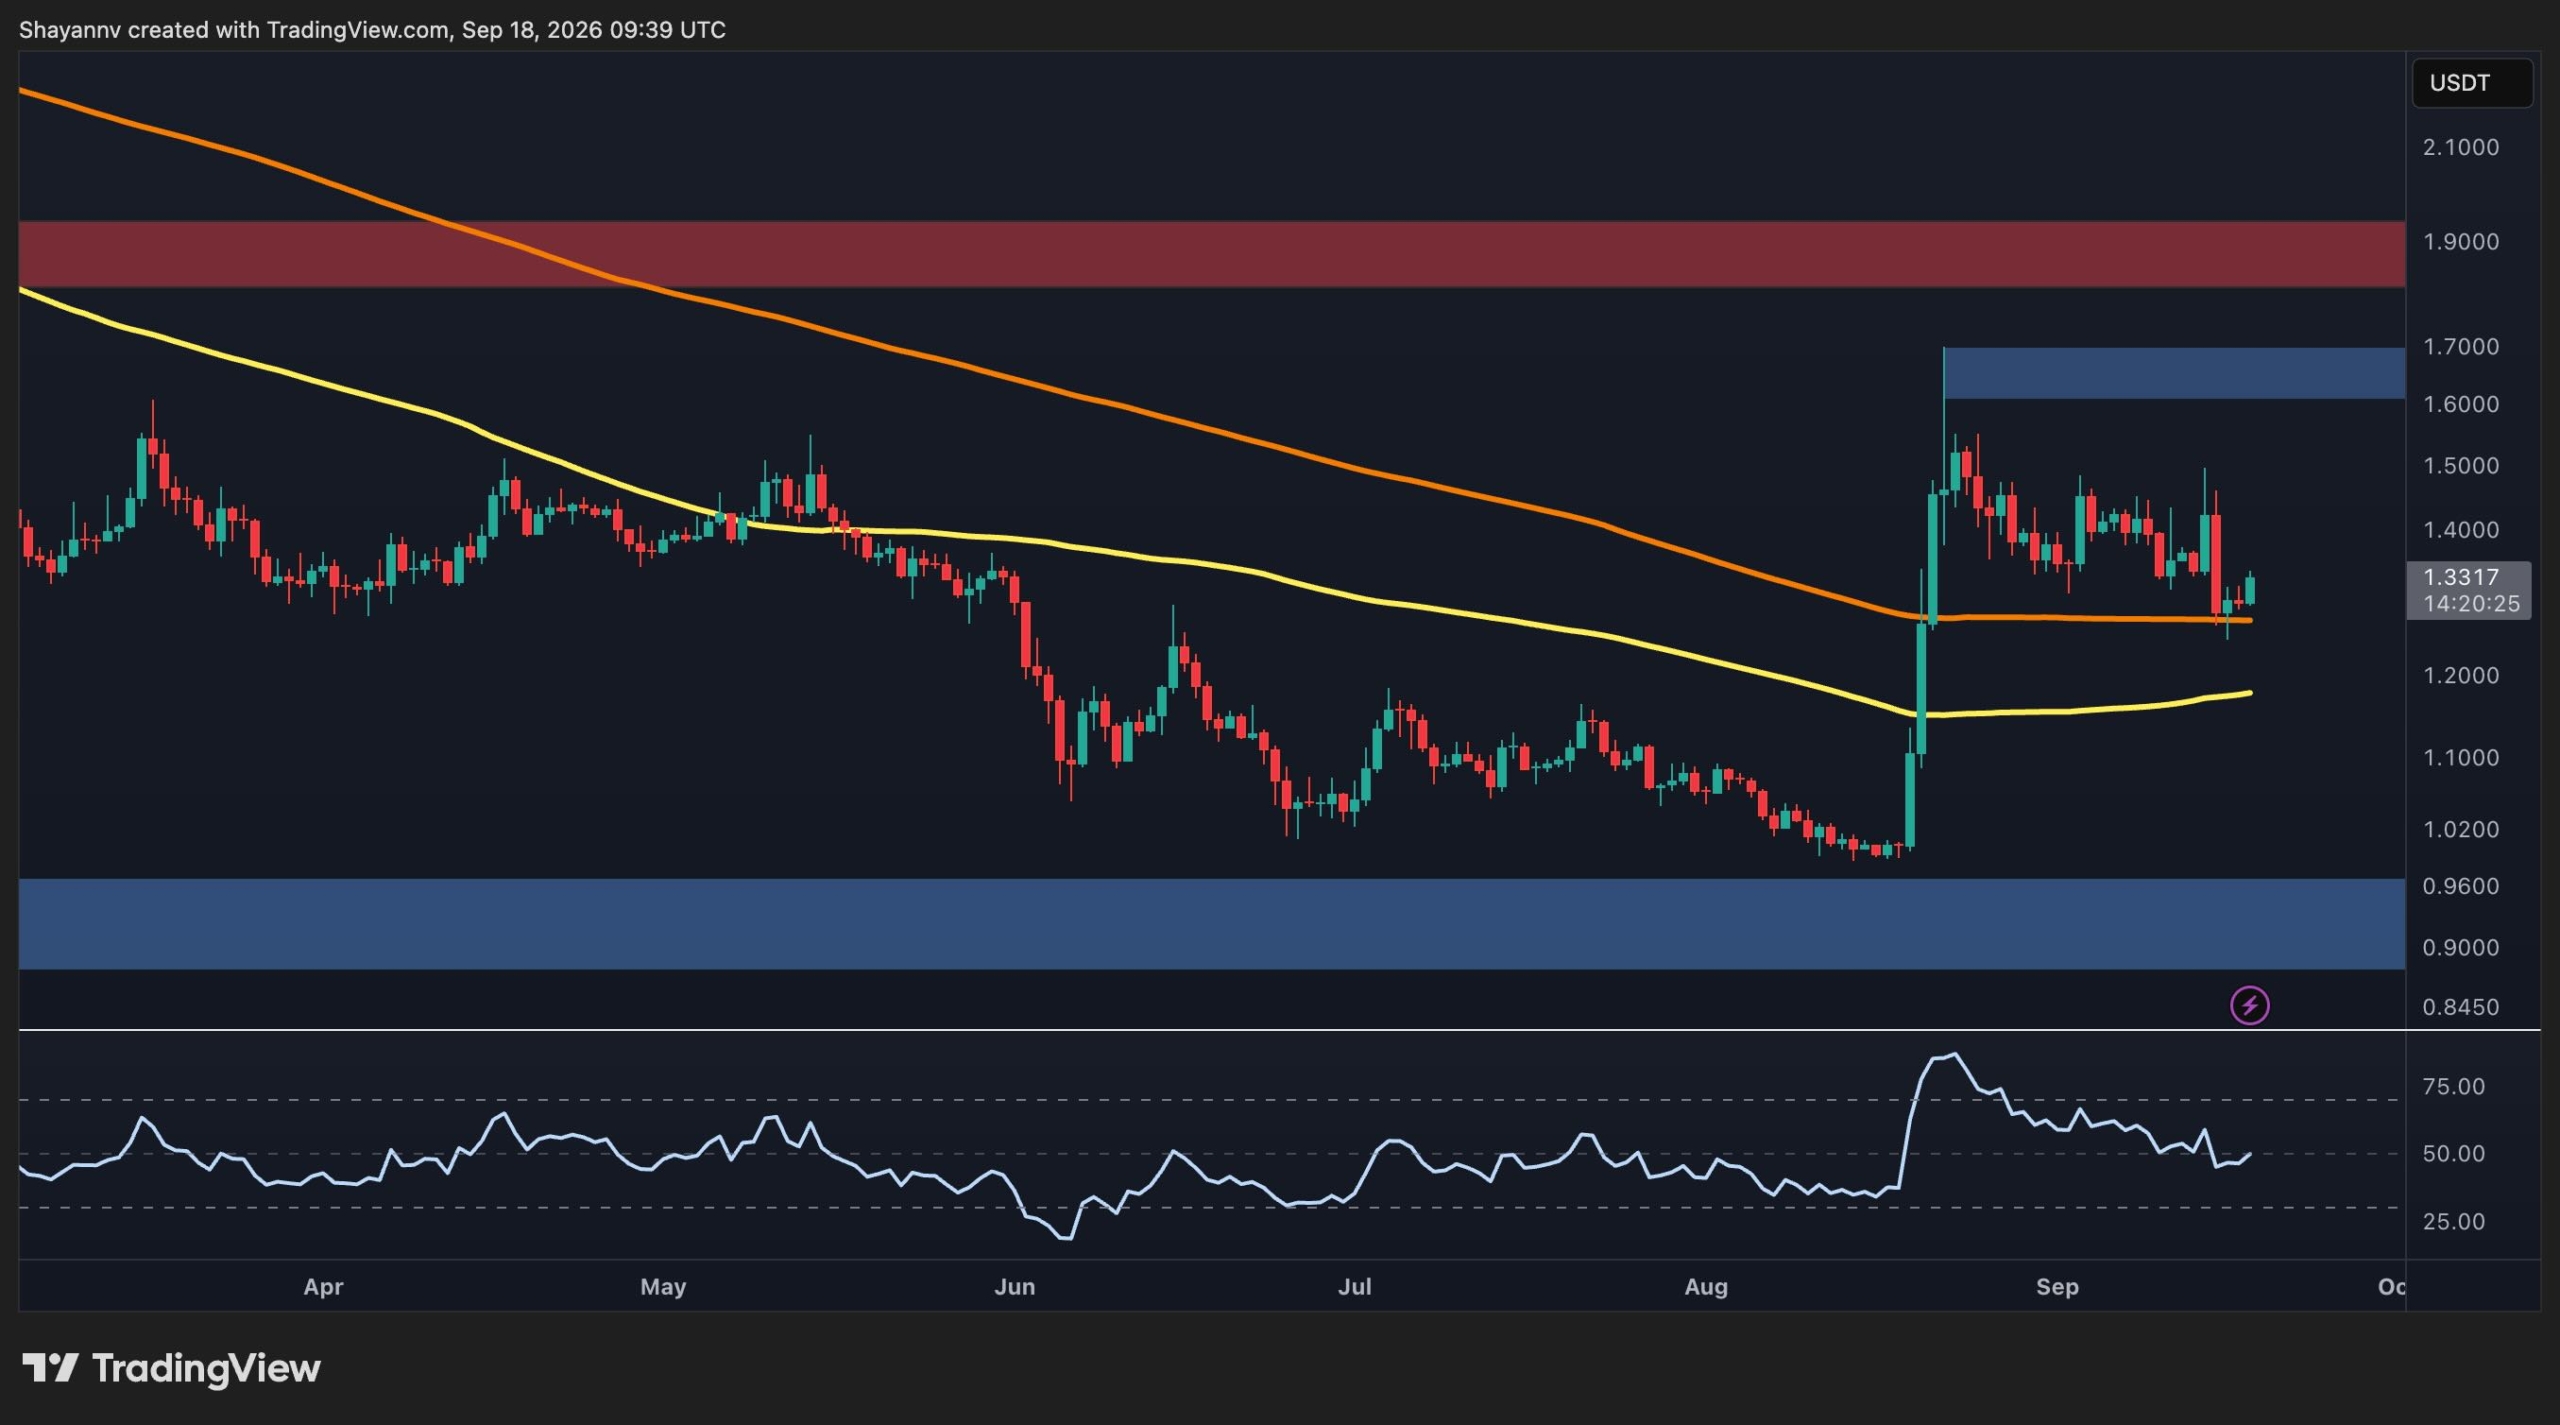
XRP is consolidating after a sharp recovery from the sub-$1 area, with the price now attempting to stabilize around $1.35. The daily chart shows a major structural improvement following the recent rally, while the 4-hour timeframe suggests that the asset is still trading inside a descending channel that is guiding a corrective price action.
Ripple Price Analysis: The USDT Pair
On the daily timeframe, XRP staged a strong impulsive move from the $1.00 support area to roughly $1.70 before entering a prolonged consolidation. The rally also pushed the RSI sharply into overbought territory, but the subsequent cooling-off phase has brought the indicator back toward the neutral 50 area.
The price is currently around $1.35, sitting just above the 200-day moving average at approximately $1.30. This is an important near-term area because holding above this zone would keep the recent structural recovery intact. The yellow 100-day moving average is also located lower, around $1.18, providing a deeper dynamic support area if the correction extends.
On the upside, the most visible resistance is the $1.60-$1.70 zone, marked by the recent swing high. A successful move through this region would put the larger $1.90 resistance zone back into focus.
On the downside, the chart’s major structural support remains around $1.00. This is substantially below the current market and therefore represents a broader invalidation area rather than an immediate support level.
The 4-Hour Chart
The 4-hour chart provides a more cautious picture. XRP has been moving inside a descending channel, with both the upper and lower trendlines sloping downward. The latest rejection from approximately $1.48 resulted in a sharp decline toward the $1.25 support zone and the lower boundary of the channel.
That support area has so far held, and XRP has started to recover toward $1.35. The immediate obstacle, however, is the $1.33-$1.37 resistance zone, which is currently being approached from below. A clean breakout and hold above this area would improve the short-term structure and could open the way toward the channel’s upper boundary around $1.40-$1.45.
Conversely, a rejection around this resistance area could lead to a move back toward the $1.25 support zone again. The lower channel trendline is also located in this area, making it an important level for the current consolidation and for investors, as losing it could lead to a much deeper correction in the coming weeks.

Disclaimer: Information found on CryptoPotato is those of writers quoted. It does not represent the opinions of CryptoPotato on whether to buy, sell, or hold any investments. You are advised to conduct your own research before making any investment decisions. Use provided information at your own risk. See Disclaimer for more information.






Be the first to comment