



Bitcoin trades in July 2026 in a range of 60,000 to 65,000 dollars, 40% below its all-time highs from late 2025. The fear and greed index remains in “extreme fear” for several consecutive days, with a reading of 25 on July 15, and a 30-day average of 19. Discussion volume on major social platforms about cryptocurrencies has fallen to levels not seen since October 2024, with weekly mentions of Bitcoin on X around 130,000. Trading volume for the largest-cap assets has reached its weakest two-year average.
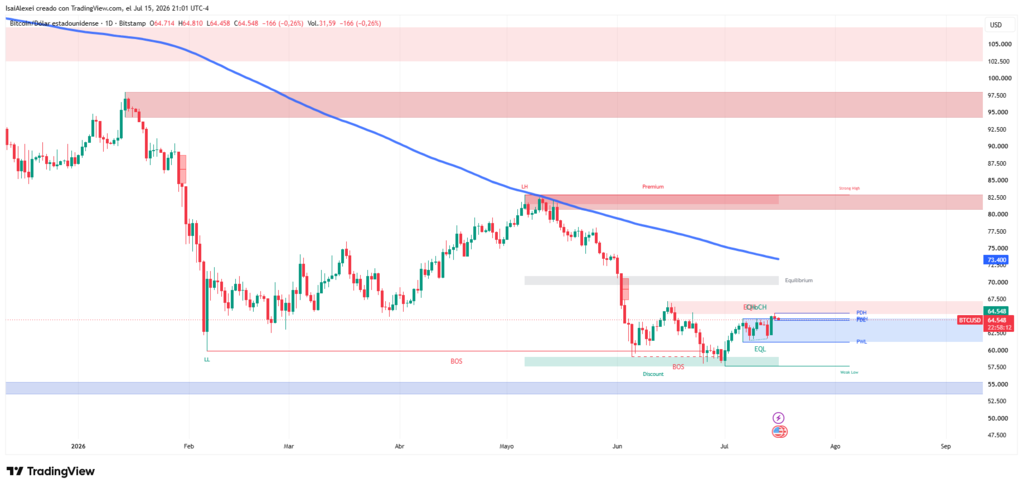
These data paint a picture of a market in a state of hibernation.
However, during that same period, wallets holding between 10 and 10,000 BTC —classified as whales and sharks— have added a net of approximately 11,000 coins in a single week. Bitcoin reserves on exchanges have declined to about 2.21 million units, their lowest level in seven years, representing only 6.6% of the total circulating supply. US spot Bitcoin ETFs, after recording record outflows of 4.5 billion dollars in June, posted a net inflow of 239 million dollars on July 14.

A divergence between the lowest sentiment readings and on-chain accumulation signals is worth examining.
Limitations of sentiment indicators
The fear and greed index and social volume are commonly used as thermometers of market mood, but their track record as contrarian signals is not consistent. In March 2020, during the covid‑19 crash, the index fell to 8, and Bitcoin went from 4,000 to 60,000 dollars in the following months. In November 2022, after the FTX collapse, the index marked 12, also coinciding with a cycle bottom. But from November to December 2018, the index remained in extreme fear for 34 days without an immediate reversal.
Extreme fear does not by itself constitute an automatic buy signal. It only indicates that market participants are predominantly pessimistic, and pessimism can persist for considerable periods.
The current price level provides another set of references. Bitcoin trades below the short-term holder cost basis (around 72,200 dollars) and below the realized price (near 76,600 dollars). This implies that a significant proportion of recent buyers are in unrealised losses. Recovery above these reference lines usually requires new demand to enter.
Segmentation of accumulation
The accumulation figure of 11,000 BTC by whales comes from Santiment’s cohort analysis. The historical behaviour of this cohort has shown some correlation with price direction, but correlation does not imply causation. More relevant is the divergence in behaviour across different wallet sizes.
✍️ TL;DR: Crypto disinterest nearing lowest levels since summer of 2024 (right before pump)
📊 Metrics Used: Social Trends
🔗 Live Chart: https://t.co/fmyPiLUKCa📉 Crypto chatter across X, Reddit, Telegram, and other social channels just hit its 2nd lowest daily level since… pic.twitter.com/AQWeBBZbws
— Santiment Intelligence (@SantimentData) July 14, 2026
During the same period, medium-sized wallets (100 to 1,000 BTC) distributed approximately 67,000 bitcoins in a single day, equivalent to about 4.3 billion dollars at the then price. CryptoQuant analyses indicate that newer whale wallets continue to accumulate, suggesting that supply is transferring among large holders, and not necessarily leaving the system.
The drop in exchange reserves to seven‑year lows also requires a cautious reading. Lower reserves are usually interpreted as a bullish signal, because they imply less supply available for sale. This interpretation only holds if demand remains stable or grows.
The intensity of ETF flows
ETF flows showed some change in mid‑July. After eight consecutive weeks of outflows, the week of July 6‑10 recorded a net inflow of about 197 million dollars. That inflow was reversed on July 13 by a single‑day outflow of 425 million, and then on July 14 another inflow of 239 million occurred.
This volatility indicates that investor behaviour in ETFs is extremely unstable in the current environment. The outflows of 4.5 billion in June set a record, and the prior eight weeks of continuous outflows exceeded 8 billion. One or two weeks of data are not enough to confirm a trend change.
ETF trading volume has decreased by 78% from the highs of late 2025, standing at around 650 to 950 million dollars daily. In a low‑volume environment, even moderate‑sized flows can have a disproportionate impact on price, but that same condition reveals fragile liquidity.
Bitcoin’s price behaviour cannot be disconnected from the broader macroeconomic environment. The Federal Reserve kept interest rates in the 3.50%‑3.75% range at its June meeting. The June CPI came in at 3.5% year‑on‑year, down from 4.2% in May, offering some relief to risk assets. However, the yield curve remains inverted, and markets are pricing rate cuts only for late 2026 or early 2027.
Geopolitics adds another layer of uncertainty
The US midterm elections, scheduled for November, introduce an additional variable regarding crypto regulation and fiscal policy.
In this context, risk appetite among institutional investors remains contained. Hedge fund flow data show a net negative allocation to cryptoassets during the second quarter of 2026, with a 12% reduction in exposure from the previous quarter, according to Bank of America surveys.
This thesis has some logic, but it is not without nuance. Whale accumulation during periods of low liquidity can indeed pave the way for an upward move, since any moderate‑sized purchase has a greater impact on the order book.
However, silent accumulation does not guarantee an immediate rebound. Recent history shows that whales also accumulated during the drop from May to July 2021, and it took several months for the price to recover previous levels.
The accumulation observed in the 10‑to‑10,000 BTC cohort is not uniform. Within that range, wallets of 10‑100 BTC have shown a slight decline in active addresses, suggesting that not all whales are buying.
The role of miners and production cost
An additional factor is miner behaviour. Network hashrate remains around 650 EH/s, near all‑time highs. The estimated production cost per Bitcoin ranges between 45,000 and 50,000 dollars for the most efficient operations, and above 55,000 for less efficient ones.
With the price at 60,000‑65,000 dollars, most miners remain profitable, but their margins have shrunk significantly from 2025 levels. Miners have shifted from net sellers to selective accumulators: miner reserves increased slightly in June, according to Glassnode data. This adds a downward supply pressure element, as miners have fewer incentives to sell at current prices.
Data on spending of inactive coins show that long‑term holders —defined as those holding Bitcoin for more than 155 days— have reduced their selling pace. The rate of old coin spending (Coin Days Destroyed) remains at low levels, indicating that the oldest investors are not liquidating positions. This metric often correlates with market bottoms: when long‑term holders stop selling, residual supply contracts.
However, a low spending rate does not necessarily mean those holders are buying. Active accumulation comes primarily from the newer whale cohorts, which have increased their holdings over the past three months.
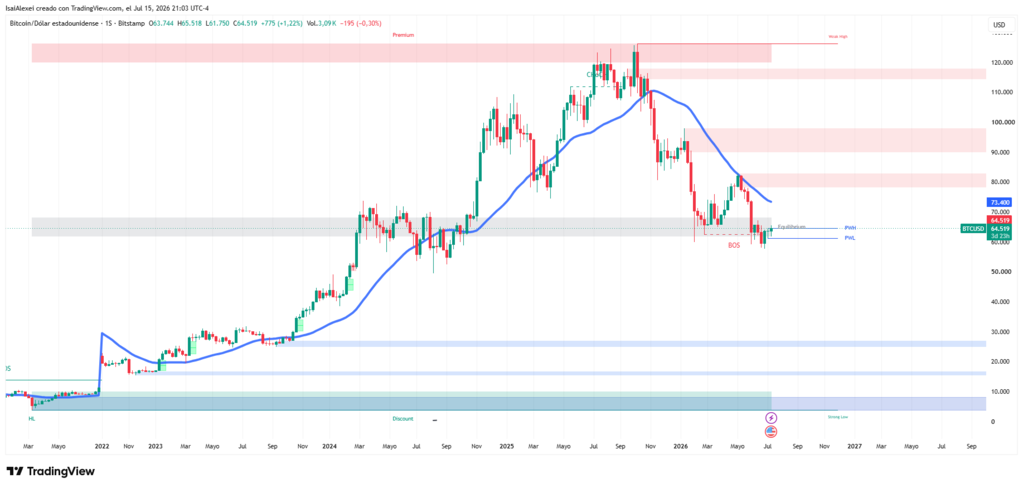
From a technical perspective, the 60,000‑65,000 range coincides with the 200‑week moving average, which has historically acted as support in bearish cycles. It also approaches the 0.618 Fibonacci retracement from the 2025 high to the 2024 low. These levels have no predictive value by themselves, but they are followed by many algorithmic traders, which can create clusters of buy orders.
On the downside, some analysts cite 56,000 dollars as additional support based on the Bitcoin power law, while others warn of a possible drop towards 46,000 or 40,000 dollars if those levels break. The wide range of these forecasts reflects current uncertainty.
Projections from firms such as Bernstein and Standard Chartered have been published in various outlets. Bernstein maintains a target of 150,000 dollars for end‑2026, implying a 138% rally from the current price. Standard Chartered expects a recovery to 100,000 dollars by year‑end. Fidelity points to support at 56,000 dollars but admits that on‑chain fundamentals do not show a clear confirmation of a bottom.
This array of predictions, from 40,000 to 150,000 dollars, demonstrates that the market lacks a solid consensus. The dispersion of targets is wider than usual, indicating that valuation models are experiencing high volatility in their inputs.
My opinion on the current scenario
The divergence between extremely negative sentiment and silent accumulation by large holders is an observable fact. It cannot be dismissed as noise. But neither can it be interpreted as an infallible signal that the price has bottomed.
The cryptocurrency market has shown in the past that bottoms tend to form when retail interest fades and institutional or large investors absorb supply. This pattern repeated in 2018, 2020, and 2022. However, in each of those cases, the bottom was not immediate; weeks or months of consolidation were needed before a sustained upward move occurred.
The key difference in 2026 is the presence of spot ETFs, which have altered the supply‑demand dynamics. ETFs act as a channel for institutional capital to enter, but also as a source of rapid outflows when sentiment deteriorates. The volatility of ETF flows in June and July suggests that this channel does not provide stability, but rather amplifies movements.
Another distinguishing factor is the interest rate environment. In previous cycles, Bitcoin bottoms coincided with expansionary monetary policies or declining rates. Currently, rates remain at restrictive levels, and expected cuts are modest.
Whale accumulation is a necessary but not sufficient condition for a rebound. Additional demand must come from new buyers, whether institutional through ETFs, or retail returning to the market. Current data show that ETFs have had net inflows in recent days, but their magnitude is small compared to previous outflows.
The behaviour of long‑term holders and miners adds structural support by reducing available supply. But reduced supply only translates into higher prices if aggregate demand exceeds supply. So far, aggregate demand remains weak.
Whale accumulation signals, falling exchange reserves, and low selling activity from long‑term holders all point to a possible floor nearby. But sentiment indicators and ETF flows do not confirm a trend change.
My opinion is that Bitcoin’s price may stay in this range for several more weeks, while large investors continue to position themselves. An external catalyst —such as a more aggressive rate cut than expected, or a positive regulatory clarification— could trigger the rebound. Without that catalyst, silent accumulation alone will not suffice to break resistance at 72,000‑75,000 dollars.
Retail investors watching from the sidelines should be aware that the bottom is not announced with headlines, but with the absence of headlines. But the absence of noise is not the same as certainty of a floor. Prudence remains the most reasonable stance until trading volumes and ETF flows show a sustained upward trend for at least two or three consecutive weeks.
Market silence is not a guarantee, but a condition. And whale accumulation is a bet, not a confirmation.


Be the first to comment