



NEAR Protocol [NEAR] was down 9.07% in the past 24 hours, with a 7.06% increase in daily trading volume. Coinalyze data showed the Open Interest was down 14.92% in a day.
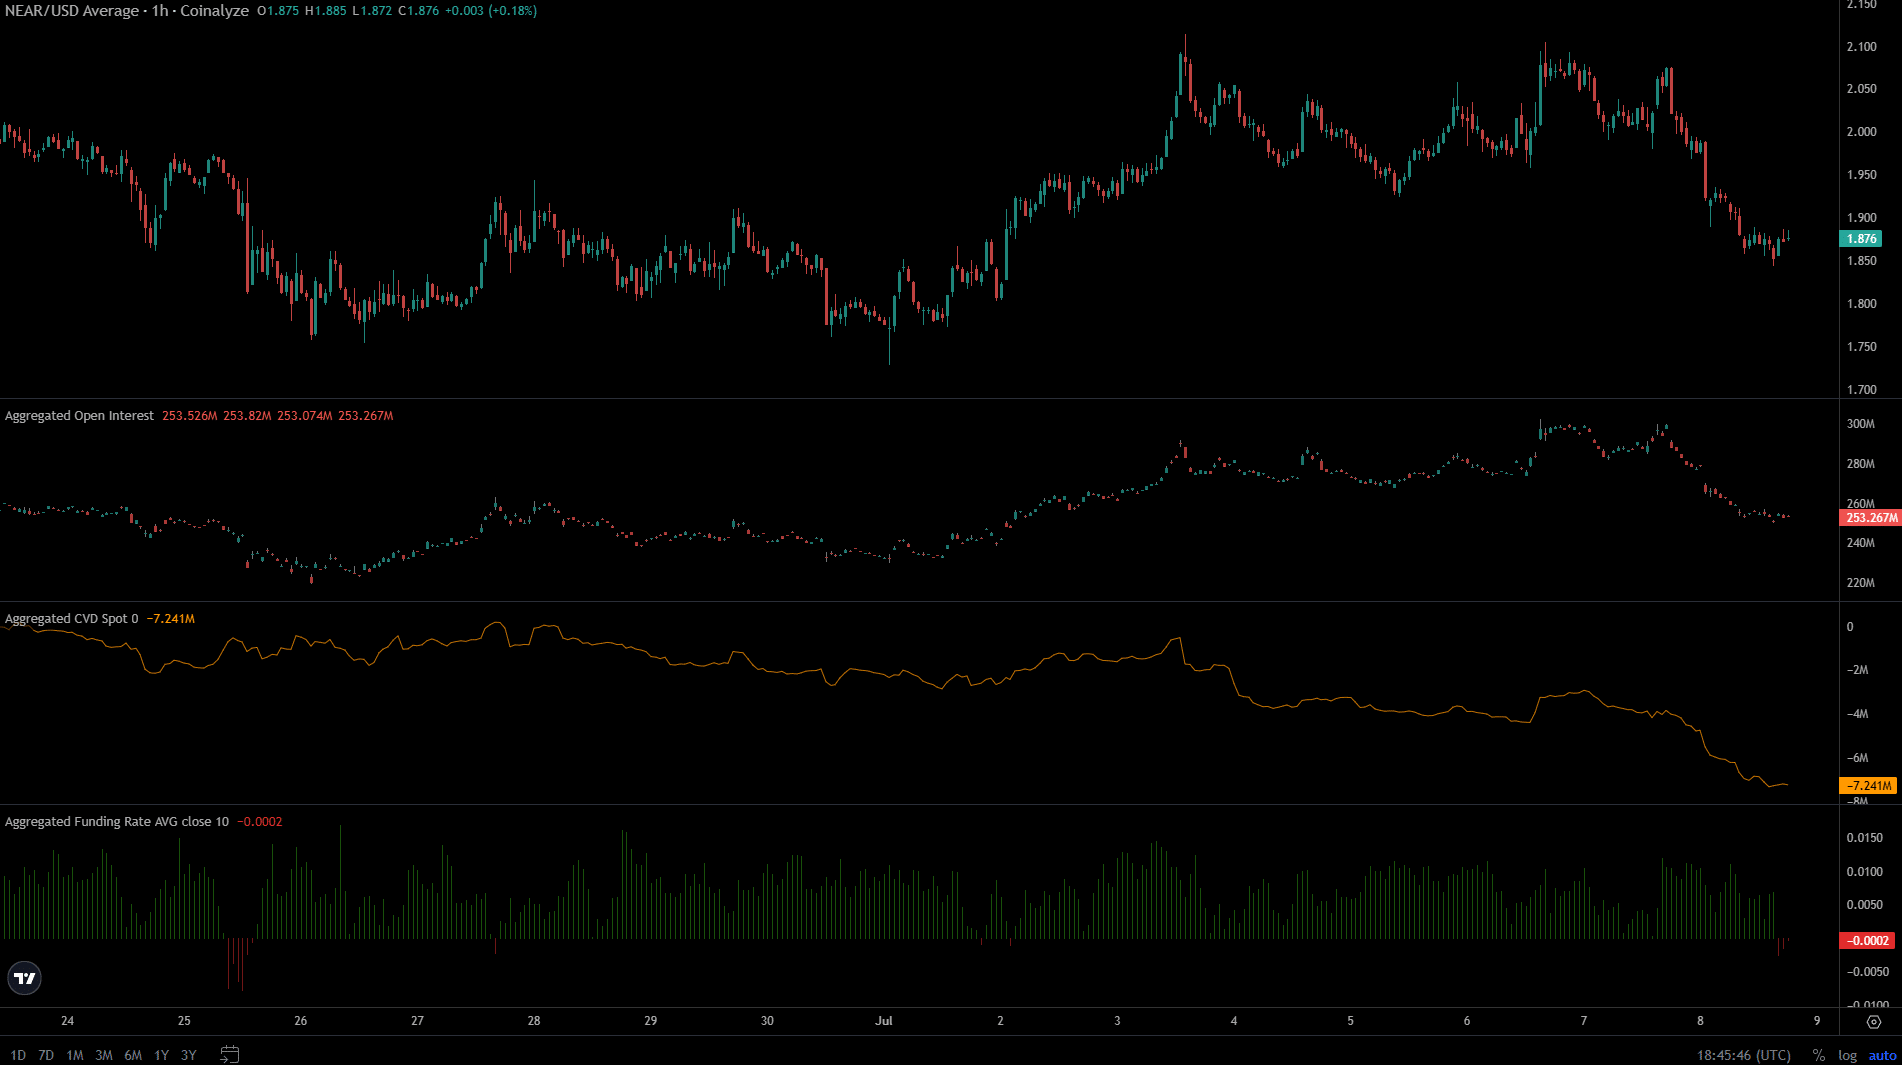
Moreover, the spot CVD has been in steady decline in recent days, and the funding rate had flipped negatively. These factors pointed to short-term stress in the NEAR market and expectations of a continued price drop.
NEAR long-term trend favors more downside
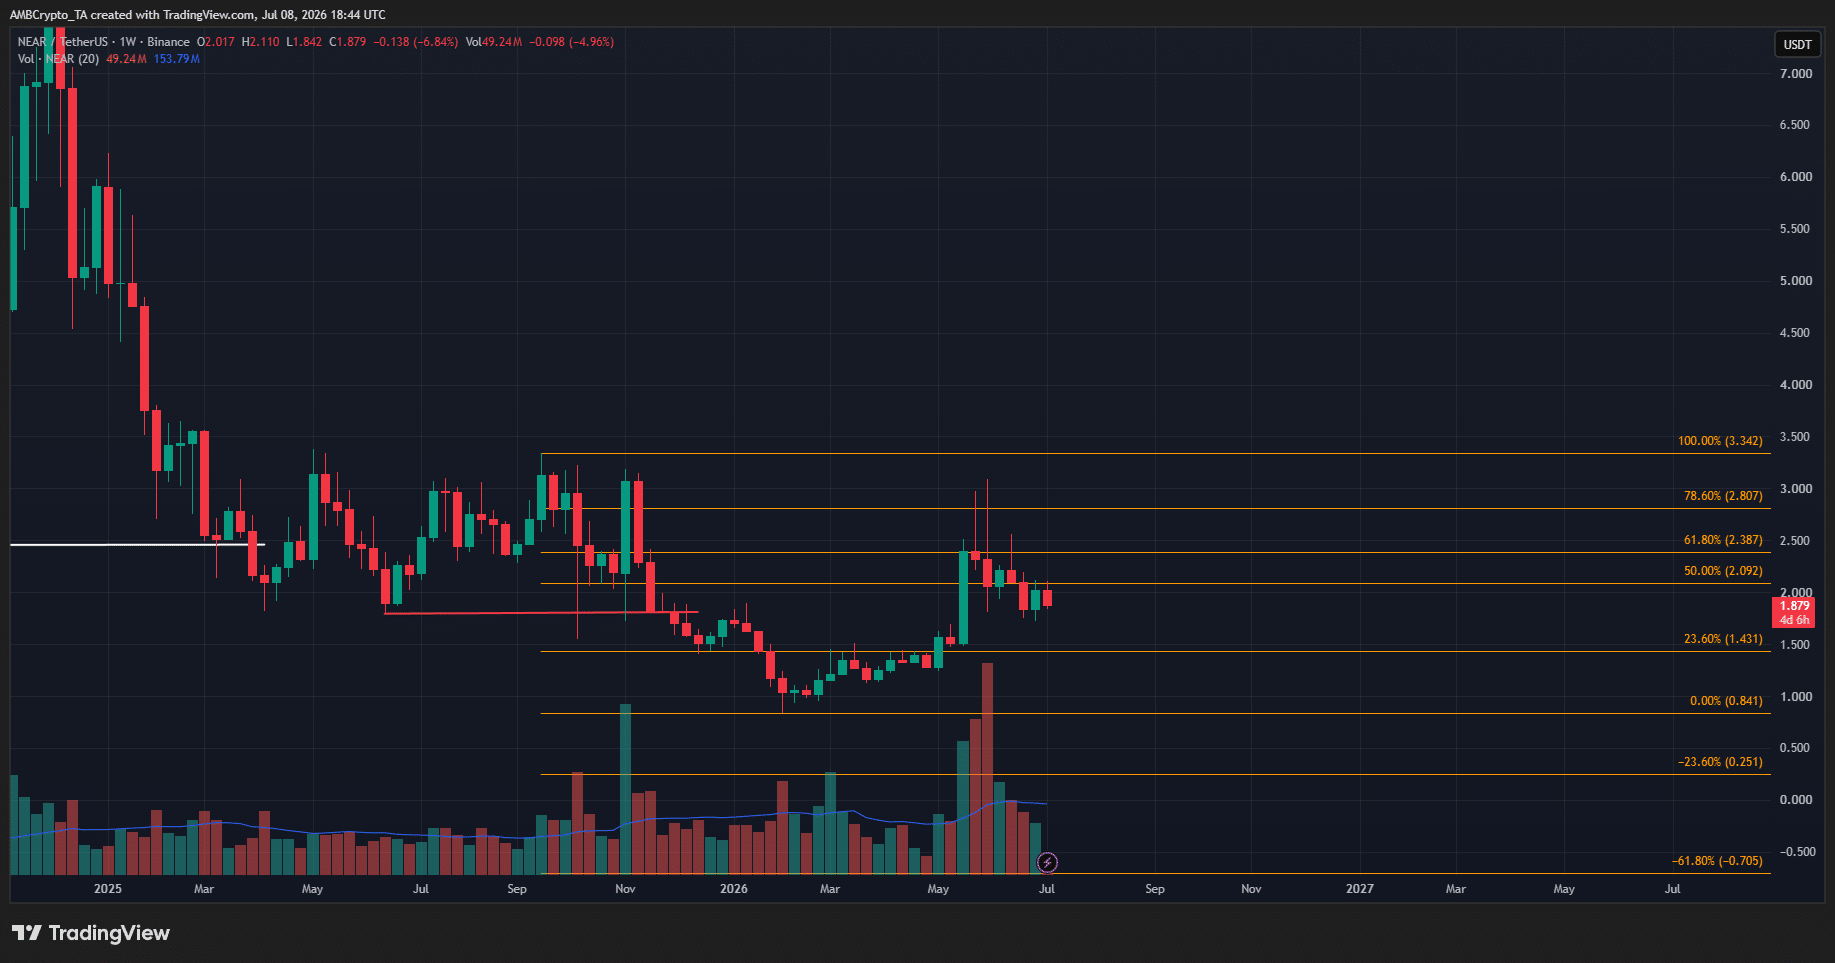
On the 1-week chart, two bearish structural confirmations were highlighted. They occurred in 2025, when the price broke below a long-term swing low, keeping the downtrend going.
At the time of writing, the swing high at $3.34 is the one bulls want to break, to flip the long-term swing structure bullishly. The buyers tried to engineer this scenario in May, but were unable to climb past the $3 resistance.

The $2.80 level marked the 78.6% Fibonacci retracement level for NEAR, and two weeks of repeated effort did not yield a positive result for the bulls. Since then, the altcoin has been in a slump.
The $2 psychological level was now a key supply zone to watch out for.
Traders’ call to action- Wait
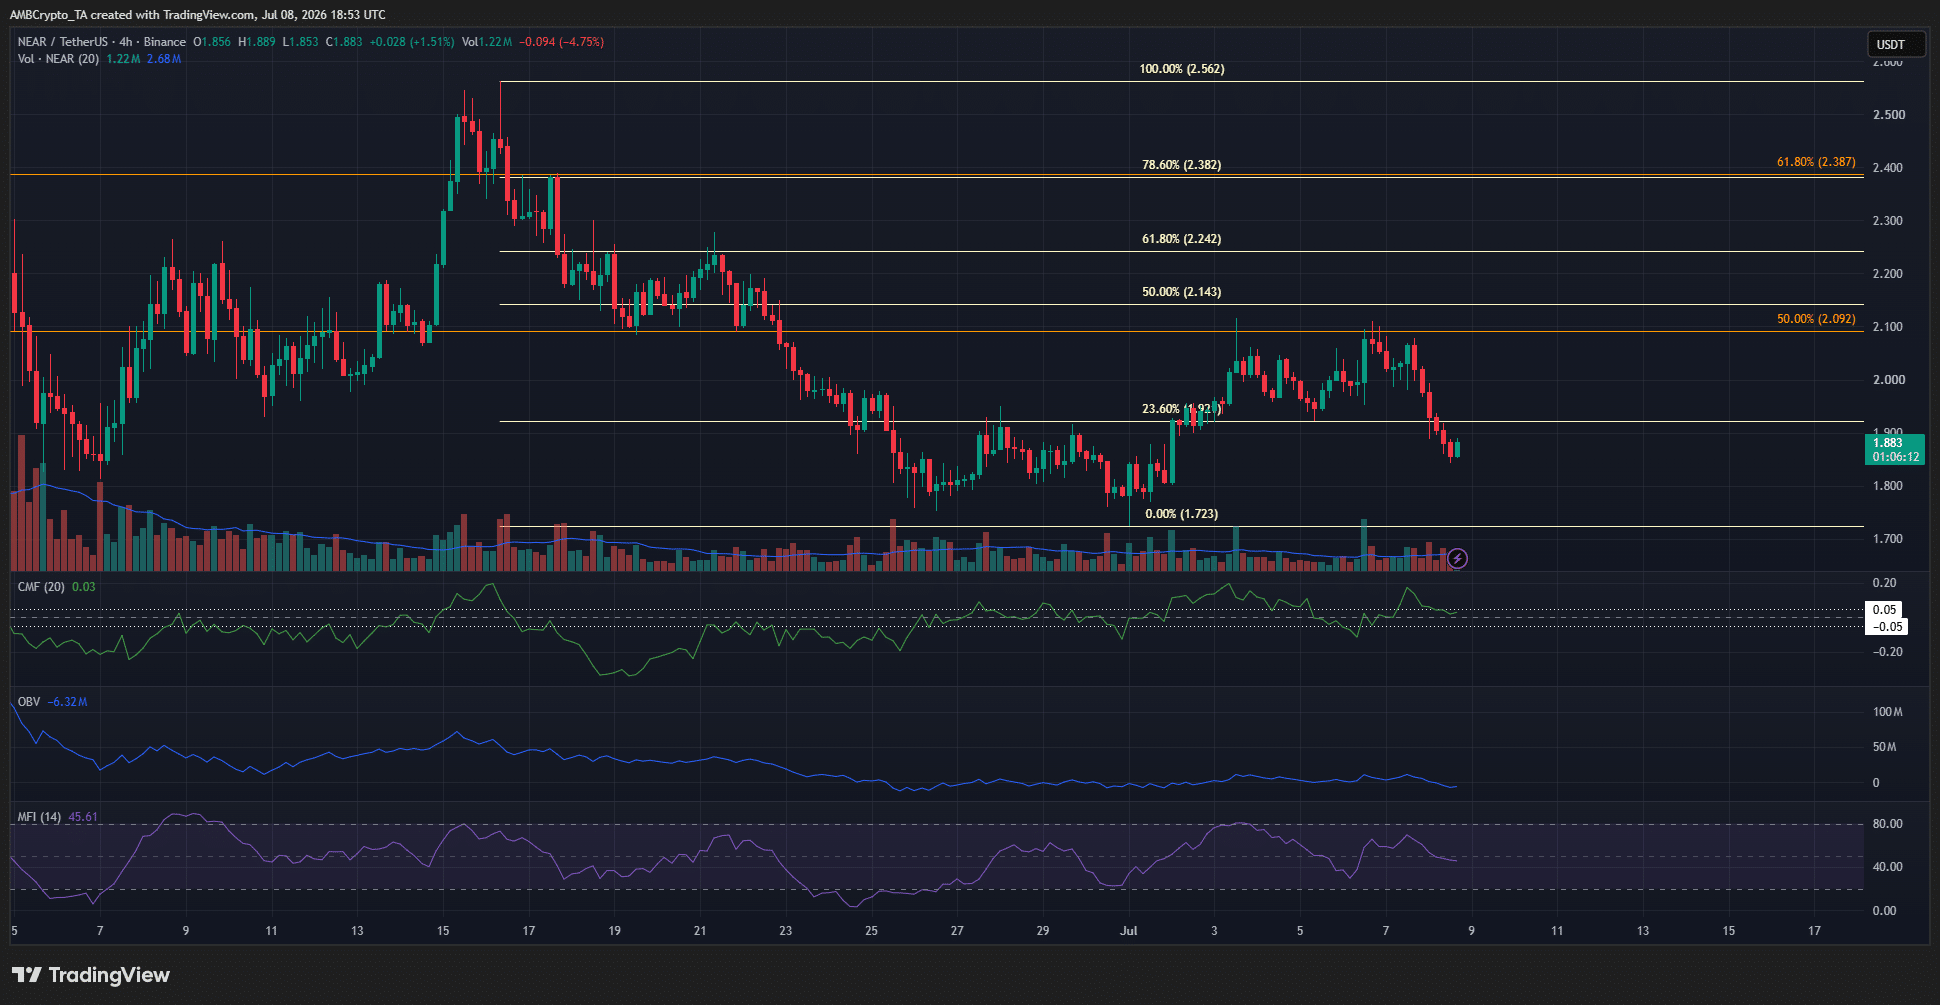
The 4-hour chart showed that the downtrend was in a retracement phase. The bounce toward $2.1 a week ago appeared to be the beginning of a pullback within the downtrend.
Based on this timeframe’s swing structure, the $2.24-$2.38 Fibonacci golden pocket would have been an ideal area for sellers to take control of the market once more.
Instead, the Bitcoin [BTC] rejection from just above $64k in recent days shifted the broader market sentiment bearishly. It brought about a NEAR price slide from $2.07 to $1.88.
The MFI was at a neutral 45, showing neither bear nor bull domination. Similarly, neither the CMF nor the OBV indicated either side was in control of the market.
Therefore, swing traders can afford to remain patient. A move toward $2.38 would offer a better risk-to-reward trade setup than a bearish bet at current market prices.
A drop below $1.72 would signal another bearish continuation, and would require a revision of the golden pocket highlighted here.
Final Summary
- The NEAR Protocol price action was bearish in the long-term and short-term.
- The price bounce earlier in July reached the $2.10 area but was unable to climb to the golden pocket at $2.24-$2.38.



Be the first to comment