

At $71 at the time of writing, SOL trades below every major moving average in a downtrend that’s run since October 2025, but it’s also resting directly on top of the largest concentration of recent buyers in its history.
Key Takeaways
- SOL trades at $71, below all three moving averages in a clear downtrend.
- Over 60M SOL changed hands between $65 and $71, the largest cost-basis cluster.
- Funding rates are near neutral, with no speculative positioning either way.
- Below $65, on-chain support is thin until roughly $53.
That makes the current level less a support or a ceiling than a decision point, the zone that could define the next move in either direction.
Where the Price Sits
The structure is bearish, with no ambiguity. SOL has fallen from a peak above $290 in January 2026 to $71 on June 28th, 2026, and all three moving averages sit overhead: the 50-day at $77.3, the 100-day at $81, and the 200-day at $95.18. Price is below all of them, a fully bearish stack.
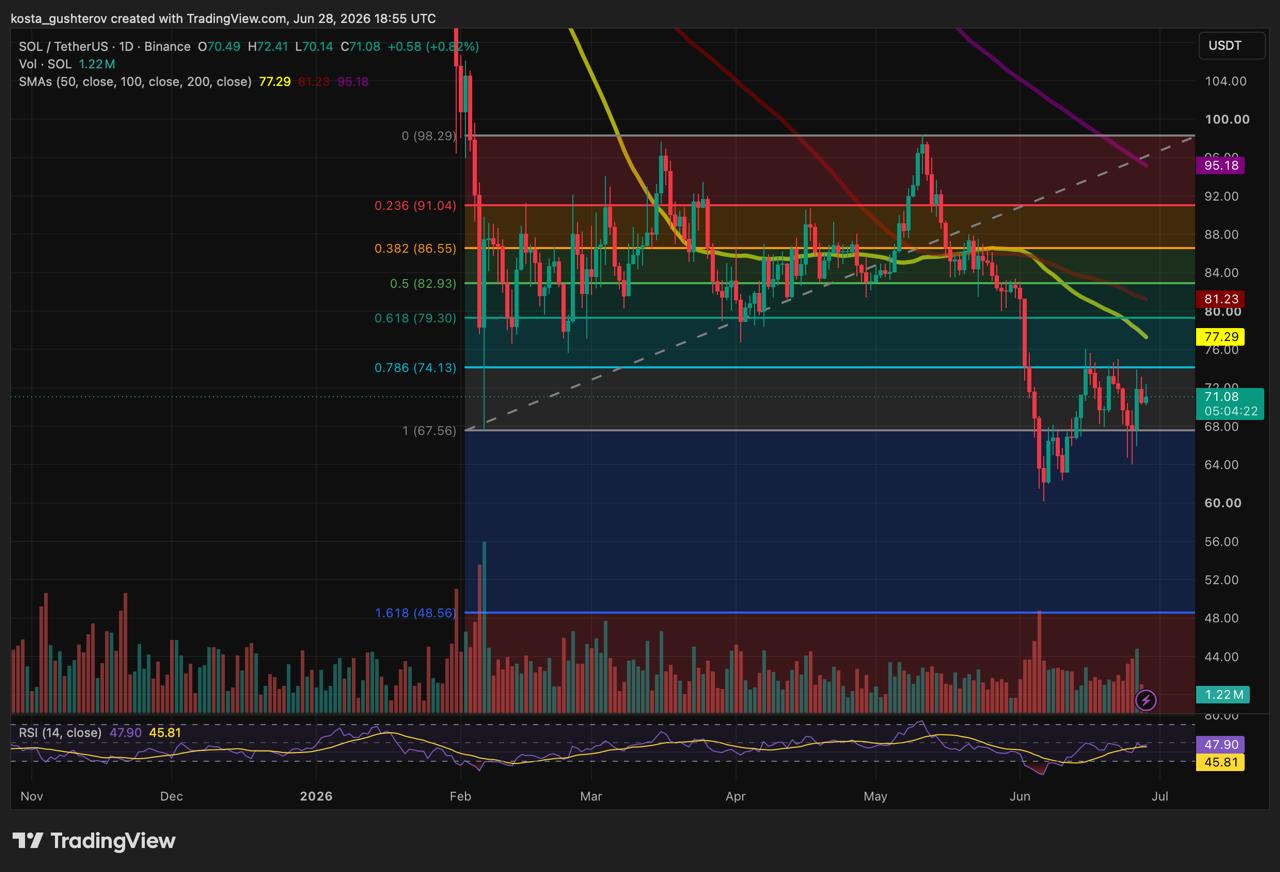
On the daily Fibonacci retracement, price is sitting between the 0.786 level at $74 and the full retracement at $67.5, which is deep, the 78.6% level is near the bottom of a measured move, and SOL has technically overshot the standard retracement range.
RSI at 47.8 with a signal line at 45.80 is neutral-to-weak, drifting just below the midline rather than oversold or recovering. The recent action backs that up: a sharp early-June drop from around $75 to a wick below $65, then choppy attempts that haven’t held above $72-73, with price now compressing in the $68-72 range on lower highs. There’s no reversal structure forming, just range compression.
The Cost-Basis Cluster That Defines the Level
Per Ali Charts citing Glassnode, more than 60 million SOL changed hands between $65 and $71, the largest single cost-basis cluster on the entire URPD chart, with the heaviest concentrations at $70.80 and $67.85. Price is currently sitting right on top of it.
More than 60 million Solana $SOL changed hands between $65 and $71, making this one of the strongest support zones.
As long as this demand cluster holds, the bullish structure remains intact.
If it breaks, the next major support levels based on the UTXO Realized Price… pic.twitter.com/t4lAKe7v6E
— Ali Charts (@alicharts) June 28, 2026
The implication cuts both ways, which is exactly why it matters. The majority of recent buyers are at breakeven or slightly underwater right now. If this zone holds, those holders have little reason to sell at a loss, and the cluster behaves like support. But if price breaks below $65 convincingly, those 60-million-plus SOL flip into loss, and historically that’s when spot selling tends to accelerate, the demand cluster becomes supply. It’s the same zone playing both roles depending on which way price moves through it.
What makes a break below $65 structurally significant is what lies beneath: very little. The fallback levels are sparse and far apart, only about 7M SOL transacted at $53.10, roughly 5M at $23.60, and around 15M at the very old $8.85 basis. The gap between $65 and $53 has thin on-chain support. That’s the risk corridor, stated as a structural fact from the data, not a prediction: if $65 gives way, there isn’t much underneath until around $53.
Derivatives Show No Conviction Either Way
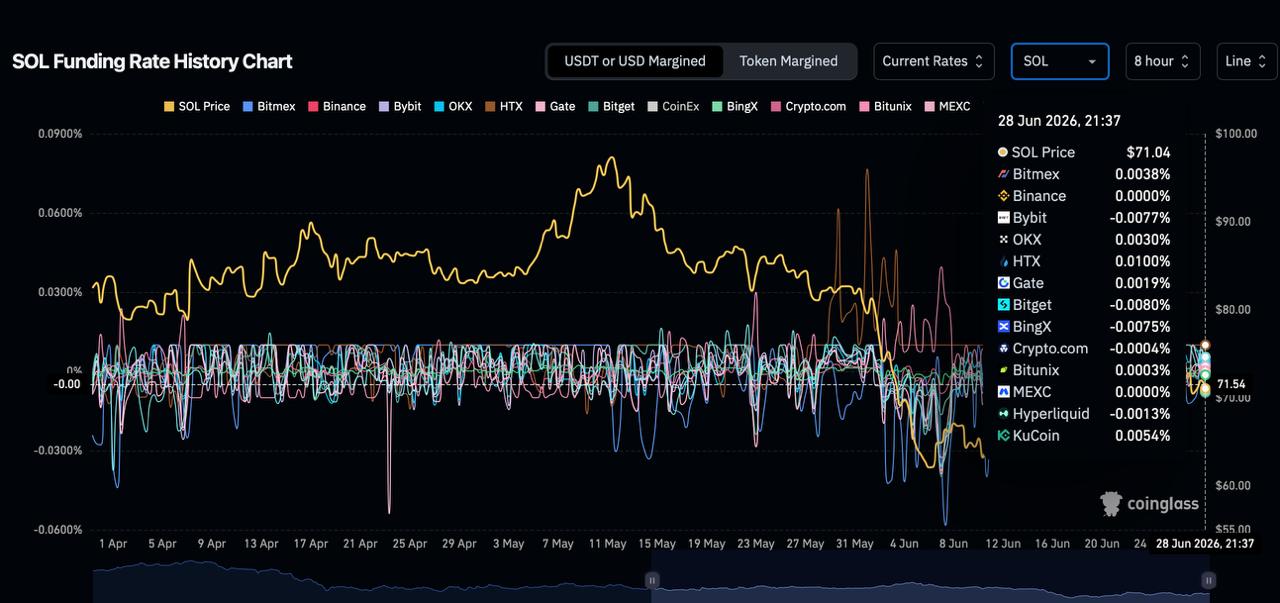
The futures market isn’t tipping the balance. Short-term funding rates across exchanges are mixed and shallow, close to zero in both directions: Bybit, Bitget, and BingX slightly negative (around -0.0077% to -0.0080%), HTX and KuCoin slightly positive (+0.0100% and +0.0054%), and Binance and MEXC flat at zero. That’s not an extreme reading anywhere, and there’s no strong consensus bias in positioning.
The longer-term view adds context. OI-weighted funding has hugged near zero or slightly negative since around November 2025, a marked contrast to the clearly positive funding that existed when SOL traded above $200. The current -0.0010% reading is negligible.
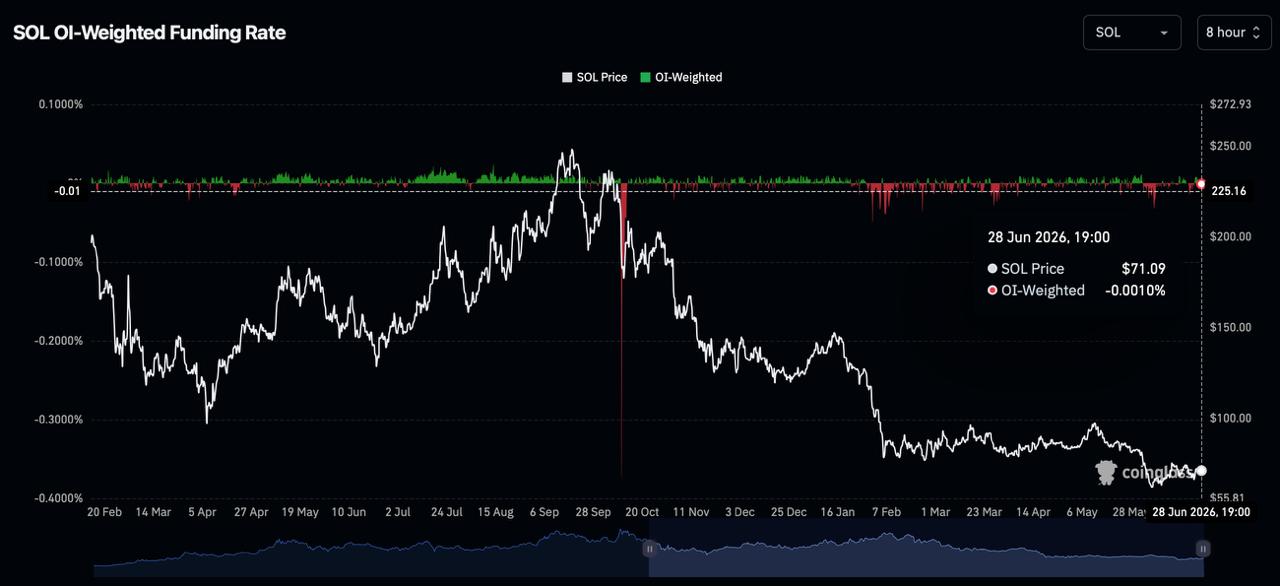
What that confirms is that speculative long premium has been fully drained from the market since the price collapse, funding was positive at the highs and has been flat-to-negative throughout the decline. There’s no speculative long buildup happening at current levels, and no aggressive short buildup either. The market is, in effect, waiting.
The Forward Binary
Three things are true at once, and together they define a sharp setup. The price structure is weak, below all moving averages, deep in Fibonacci territory, RSI under 50, with no recovery pattern. The price is sitting on the single largest cost-basis cluster in SOL’s recent history, which is both its support and its risk. And derivatives show no directional conviction in either direction, with the market essentially in wait mode.
That leaves a clean binary, and it’s worth stating without spin. If the $65-71 zone holds, the cost-basis cluster absorbs selling and acts as a floor, recent buyers don’t crystallize losses, and the level might hold. If $65 breaks with volume, those 60M-plus coins flip to loss, the cluster probably turns into supply, and the next meaningful on-chain support sits all the way down near $53 with little in between. The data doesn’t favor one outcome over the other; it just defines, with unusual clarity, exactly where the line is.
This article is for informational purposes only and does not constitute financial advice. Consult a professional before making investment decisions.

Kosta has reported on cryptocurrency markets and blockchain infrastructure since 2020, bringing over six years of hands-on experience in the crypto industry built through daily tracking of markets, trends, and emerging blockchain developments. Specializing in Bitcoin on-chain analysis, institutional ETF flows, and digital asset price action, his work at Coindoo has been cited by other news agencies and consistently covers market developments with a focus on data-driven reporting across Bitcoin, Ethereum, Solana, and XRP.
Over the years, Kosta has contributed to multiple crypto media outlets in different regions, authoring over 6,000 articles across the sector. His reporting spans cryptocurrency markets and the broader fintech industry, tracking not only price action but also the technological and regulatory forces shaping the ecosystem.
To support his analysis, Kosta actively leverages on-chain data and metrics from leading platforms such as Santiment, Glassnode, and CryptoQuant, enabling deeper, evidence-based market insights. He believes in the power of transparency and the data that underpins the blockchain ecosystem.
His academic background in Marketing Management from Denmark further complements his analytical approach, adding a strong understanding of communication strategy and content positioning to his work.

Be the first to comment