



Arbitrum [ARB] fell 10% over 24 hours after its rally stalled near $0.25. The reversal tested whether the Robinhood Chain narrative could withstand a broader market sell-off.
ARB dropped as low as $0.214 before trading near $0.217 at press time. Trading Volume also fell 31%, pointing to quieter activity during the decline.
The token had ranked among the market’s top gainers a day earlier. AMBCrypto linked that rally to Arbitrum’s role in Robinhood Chain and tokenized stocks.
Then came the reversal. Coinalyze data showed more than $1.9 million in long liquidations as ARB slipped from $0.25.

Why did Arbitrum inflows reverse?
Arbitrum’s [ARB] recent gains drew support from its Robinhood Chain connection. However, the latest market pullback coincided with a reversal in network flows.
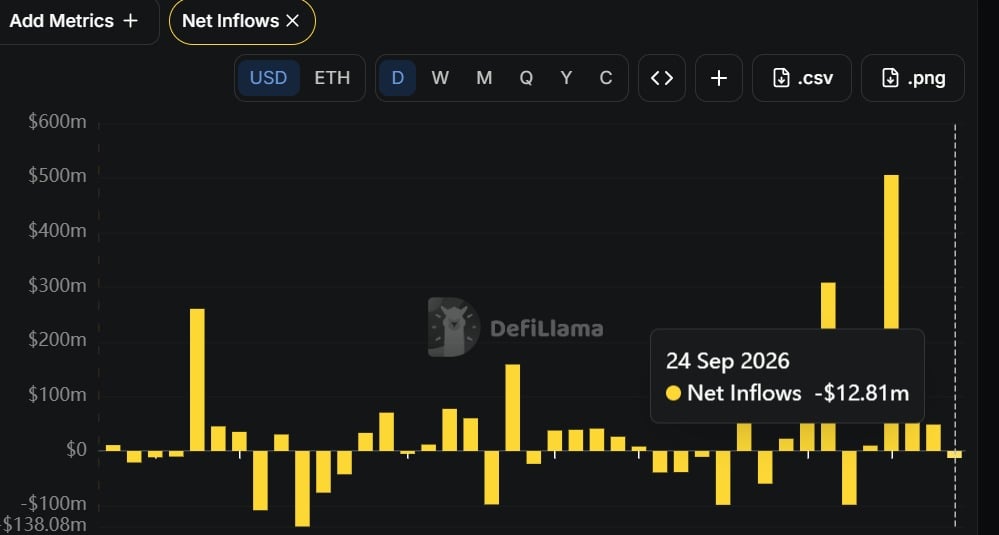
The DefiLlama chart showed four consecutive days of positive readings before USD Inflows turned negative.
Three days earlier, the reading had climbed to $503 million. At press time, it stood at -$12.8 million. That was a sharp change in direction, though the flow reading alone could not explain ARB’s price drop. Derivatives traders were pulling back too.
Are ARB traders reducing exposure?
ARB’s Open Interest fell 10% to $290 million, while derivatives Volume declined 28% to $697 million.
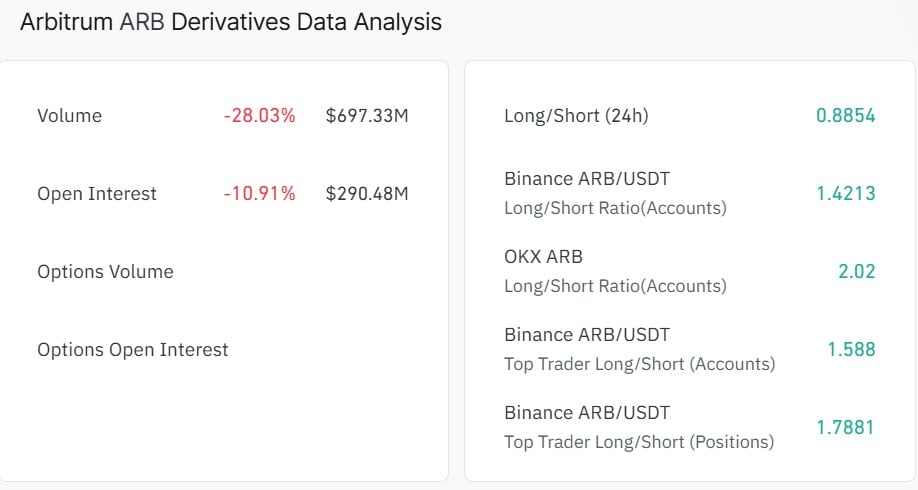
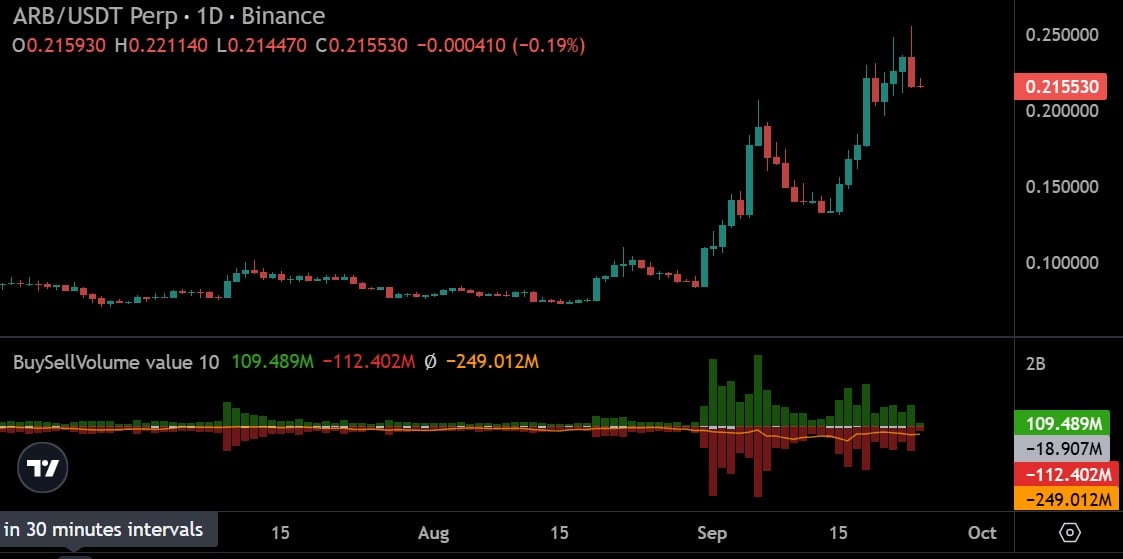
Meanwhile, Coinalyze showed Perpetuals sell volume climbing to $112 million. Net buying fell to -$249 million on the displayed measure.
Together, those readings pointed to weaker participation and stronger selling during the pullback. Falling Open Interest also suggested that outstanding positions had shrunk.
The retreat left fewer traders backing the earlier move. Still, price structure offered bulls one more test.
Can ARB price hold $0.20?
Despite the sell-off, the chart’s Trend Strength Index maintained an upward trajectory. ARB also held above its short-term Moving Averages.
Those signals left room for a recovery if selling pressure eased. A move back above $0.24 could then put the recent rally back in play.
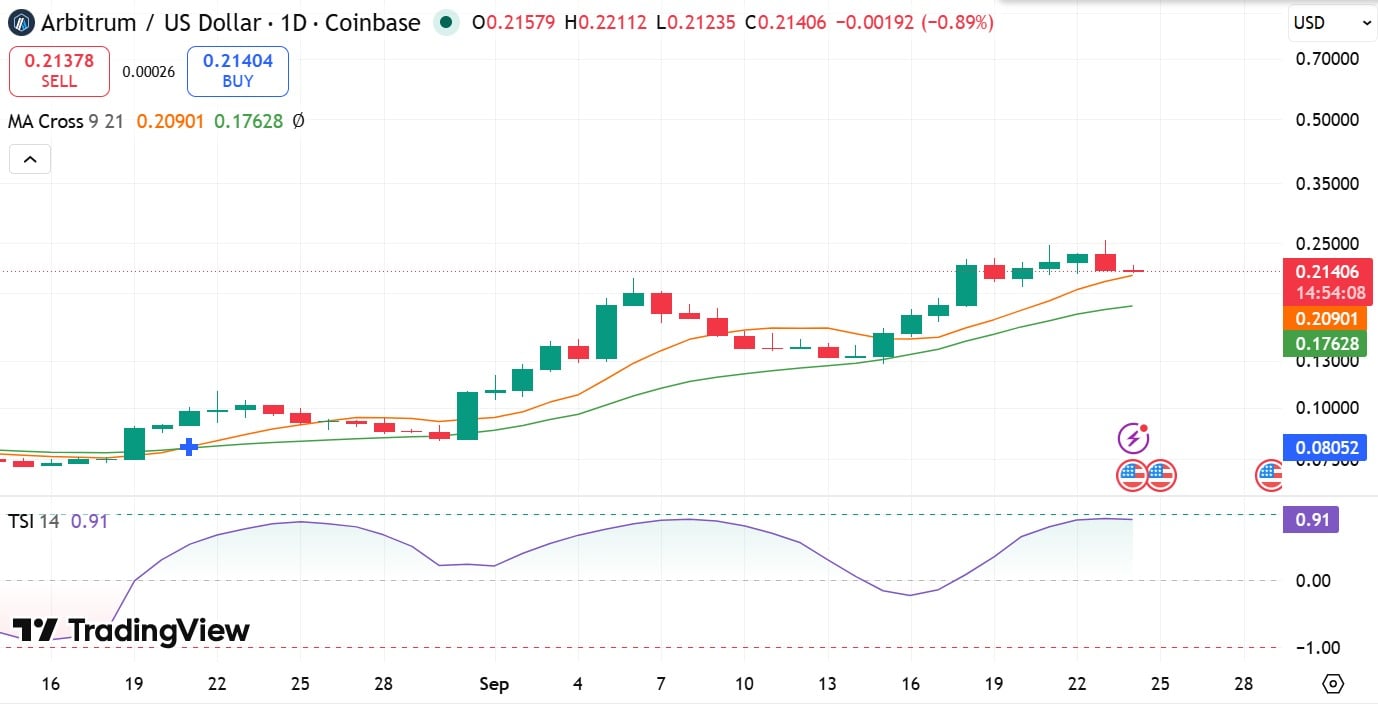
First, bulls would need to defend $0.20. Losing that level could open a deeper move toward $0.17.
Robinhood Chain remained part of Arbitrum’s longer-term story. The immediate question was whether buyers would show up at the price level that story now had to defend.
Final Summary
- ARB fell 10% after rejection near $0.25, while USD Inflows reversed to -$12.8 million.
- Open Interest dropped as traders reduced exposure; holding $0.20 could keep ARB’s recovery case alive.





Be the first to comment