


Bitcoin price has recovered above $84,000 on October 12, but weakening institutional demand, elevated Treasury yields and resistance near $85,000 have continued to limit its gains.
Summary
- Bitcoin has recovered above $84,000 but continues to face resistance near $85,000 after several failed attempts to break $87,000.
- US spot Bitcoin ETF withdrawals and elevated Treasury yields have weighed on demand, although fund flows improved slightly on Friday.
- Bitcoin remains above its major daily moving averages, with Aroon Up at 71.43% indicating that buyers retain an advantage.
- The four hour MACD has turned positive, while Chaikin Money Flow at 0.20 indicates renewed buying pressure.
- A break above $85,000 could open the way toward $86,500 and $87,400, while the 20 day EMA near $83,386 provides immediate support.
According to TradingView data, Bitcoin (BTC) was trading at approximately $84,234 at the time of writing, up around 0.55% on the daily candle. The cryptocurrency reached an intraday high of $84,290 after recovering from a low of $83,462.

The recovery follows a difficult week for Bitcoin, during which its price briefly fell toward $80,000 after repeatedly failing to sustain gains above $87,000.
Although buyers have returned at lower prices, recent U.S. spot Bitcoin ETF withdrawals and uncertainty over the Federal Reserve’s next interest rate decision have kept traders cautious.
Technical indicators now show improving buying momentum, with Bitcoin trading above its major daily moving averages. However, a move above $85,000 remains necessary before the cryptocurrency can challenge its recent highs.
Bitcoin price remains under pressure
Institutional demand has weakened considerably since late September, when U.S. spot Bitcoin ETFs attracted approximately $2.39 billion in weekly inflows.
According to an October 5 Bitfinex Alpha assessment, weekly inflows subsequently fell to $241.1 million for the period ending October 2, a decline of nearly 90%.
As crypto.news previously reported, Bitfinex analysts attributed Bitcoin’s repeated failures near $87,000 partly to insufficient spot buying, despite increased activity in futures markets.
The analysts found that futures open interest rose by $2.1 billion ahead of the September U.S. employment report before declining by $1.5 billion as Bitcoin retreated.
In their assessment, leveraged trading had helped push prices higher without enough direct purchases to sustain the advance.
ETF flows deteriorated further during the following week. According to data compiled by Alpha Finance, U.S. spot Bitcoin ETFs recorded $484.9 million in net outflows on October 7, followed by another $244.1 million on October 8.
Friday brought some relief, with the funds attracting $21.1 million in net inflows on October 9. However, the modest recovery was insufficient to offset the preceding withdrawals.
Macroeconomic conditions have created another obstacle for Bitcoin.
U.S. Treasury yields climbed as oil prices rose amid tensions in the Middle East, while the stronger dollar weighed on demand for risk assets.
The benchmark 10-year Treasury yield exceeded 5.3% during the first week of October, making government debt comparatively attractive to investors seeking returns with less volatility.
Federal Reserve policy has remained another source of uncertainty.
In recent comments, Federal Reserve Vice Chair Philip Jefferson indicated that policymakers may need more time before considering another interest rate increase.
Although expectations of an October pause have improved, inflation remains a concern following September’s rate hike.
Bitcoin’s gradual recovery on Monday has coincided with some easing in oil prices and geopolitical concerns, helping risk sentiment recover from last week’s selloff.
Traders are now awaiting the September U.S. Consumer Price Index report on October 14, which could influence expectations for the Fed’s October 27–28 policy meeting.
Market indicators have improved
Bitcoin’s daily technical structure remains positive despite its failure to reclaim $85,000.
On the daily TradingView chart, BTC was trading at $84,233.79, above its 20-day exponential moving average at $83,385.98 and its 50-day EMA at $80,216.67. See below.
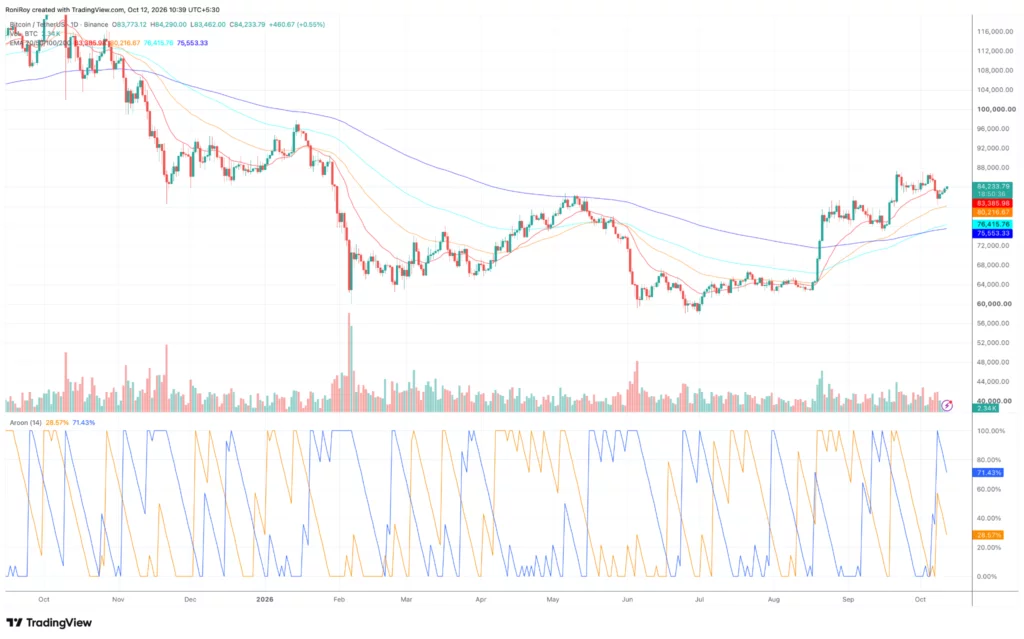
The 100-day and 200-day EMAs were positioned lower at $76,415.76 and $75,553.33, respectively.
With the shorter moving averages remaining above the longer ones, the arrangement suggests that Bitcoin’s recovery trend has not yet broken down.
The 20-day EMA provides the first important support level if Bitcoin loses momentum around $84,000.
A daily close below $83,386 could expose the $82,000 region, while a deeper decline would bring the 50-day EMA near $80,217 into focus.
The Aroon indicator presents a similar picture, although its latest readings suggest some moderation in trend strength.
On the 14-period setting, Aroon Up stood at 71.43%, compared with Aroon Down at 28.57%.
The difference indicates that recent highs remain more influential than recent lows, consistent with buyers retaining control of the daily trend.
However, Aroon Up has retreated from its previous higher readings, suggesting the upward move has slowed since Bitcoin approached the $87,000 region.
The market has encountered resistance around that price several times since late September.
In an October 6 analysis, Bitcoin’s repeated rejection near $87,000 was linked to a concentrated resistance area, while analyst Ali Martinez identified approximately 1.59 million BTC acquired between $83,300 and $84,600.
Martinez used Glassnode’s realized price distribution data to identify the purchase concentration, which could provide support when Bitcoin revisits that range.
His analysis placed the next important breakout threshold around $86,700.
Shorter timeframe indicators have become more favorable as Bitcoin recovers from last week’s decline.
On the 4-hour chart, the Moving Average Convergence Divergence indicator has moved into bullish territory, with the MACD line at 207.64 and the signal line at 75.07.
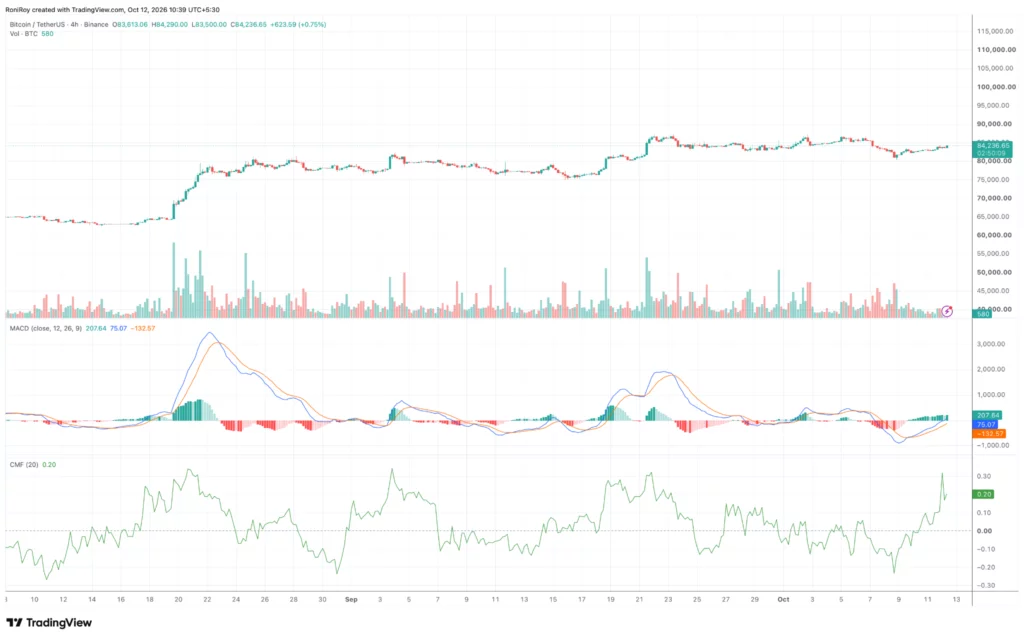
The positive histogram reading of 132.57 indicates that the MACD line has moved above its signal line, with momentum improving during the latest recovery.
A continuation of positive histogram readings would support another attempt to reclaim $85,000, particularly if Bitcoin can sustain trading above the recent $84,290 intraday high.
The Chaikin Money Flow indicator provides another positive signal.
CMF stood at 0.20 on the 20-period setting, having recovered from negative territory during the recent selloff.
A positive reading indicates that buying pressure has outweighed selling pressure over the indicator’s measurement period.
The latest reading has eased from a recent high near 0.30, but it remains comfortably above the zero line.
Can Bitcoin price break above $85,000?
Bitcoin’s immediate challenge is to sustain trading above $84,300 before attempting another move toward $85,000.
A convincing break above that psychological level could bring $86,500 into focus, followed by the 87,000–87,400 resistance area that has repeatedly stopped previous rallies.
Beyond those levels, $90,000 remains a possible upside target if spot demand improves.
Bitfinex analysts previously identified a daily close above $87,722, supported by several ETF sessions attracting at least $340 million each, as conditions that could strengthen the case for a move toward $90,000.
The downside scenario begins with the 20-day EMA around $83,386.
Failure to defend that average could expose $82,000, a level previously identified by ViaBTC chief analyst Jeff Ko and Bitget Wallet research lead Lacie Zhang as important support.
In their October Bitcoin market assessment, the analysts identified institutional buying, inflation data and Treasury yields as major factors influencing the cryptocurrency’s direction.
Zhang placed a potential downside liquidation area between $82,000 and $82,500, with a loss of that region opening the possibility of a decline toward $80,000.
The daily 50-day EMA at $80,217 sits close to that psychological support level, making it another technical reference if selling resumes.
A deeper correction could bring the 100-day EMA near $76,416 into consideration, although such a move would require a more substantial deterioration in the current price structure.
Disclosure: This article does not represent investment advice. The content and materials featured on this page are for educational purposes only.



Be the first to comment