



Crypto absorbed a failed US regulatory vote and two central-bank rate increases before Bitcoin reached $87,374. The retreat began as oil rebounded, Treasury yields rose and traders had substantial monthly gains available to protect.
Bitcoin traded near $84,500 at the time of writing, while XRP had fallen from $1.60 to approximately $1.52 and the total crypto market had slipped below $2.9 trillion. The retreat remained modest relative to the recent rally, but the conditions surrounding it had changed.
BITCOIN
$87,374 → $84,500
About 3.3% below the local high
XRP
$1.60 → $1.52
About 5% below resistance
CRYPTO MARKET
Below $2.9T
Altcoins returned part of their larger gains
Why earlier bad news did not stop the rally
The market had already absorbed three developments that would normally be expected to pressure speculative assets.
September 15: CLARITY fails in the Senate
The vote delayed US market-structure legislation, but it did not immediately change trading conditions.
September 16: The Fed raises interest rates
Higher rates increased the return available from lower-risk assets, yet Bitcoin continued toward its May high.
September 18: The BOJ raises its policy rate
The decision increased carry-trade risk, but the yen weakened because the move was expected and two board members dissented.
The CLARITY Act’s failed vote was a political setback rather than an immediate restriction on crypto trading. It delayed legislation without forcing exchanges to change their operations, while the SEC and CFTC retained authority to act under existing law.
The Federal Reserve then raised its target range to 3.75%–4%. That maintained a difficult monetary backdrop, but the move had been anticipated and did not prevent Bitcoin from clearing its May peak near $82,800.
The Bank of Japan followed by lifting its policy rate from 1% to 1.25%, its highest level in 31 years. Higher Japanese rates can disrupt trades funded with inexpensive yen, potentially forcing investors to reduce positions in other markets. This time, however, the yen weakened after the announcement and the feared rush out of global risk assets did not immediately materialize.
The common thread was expectations. None of the three developments surprised the market enough to overpower the buying already underway.
Short liquidations temporarily accelerated the move
The rally was not supported by derivatives positioning alone. US spot Bitcoin ETFs reportedly attracted nearly $1 billion in one session and approximately $1.59 billion across three sessions, providing measurable demand through regulated investment products.
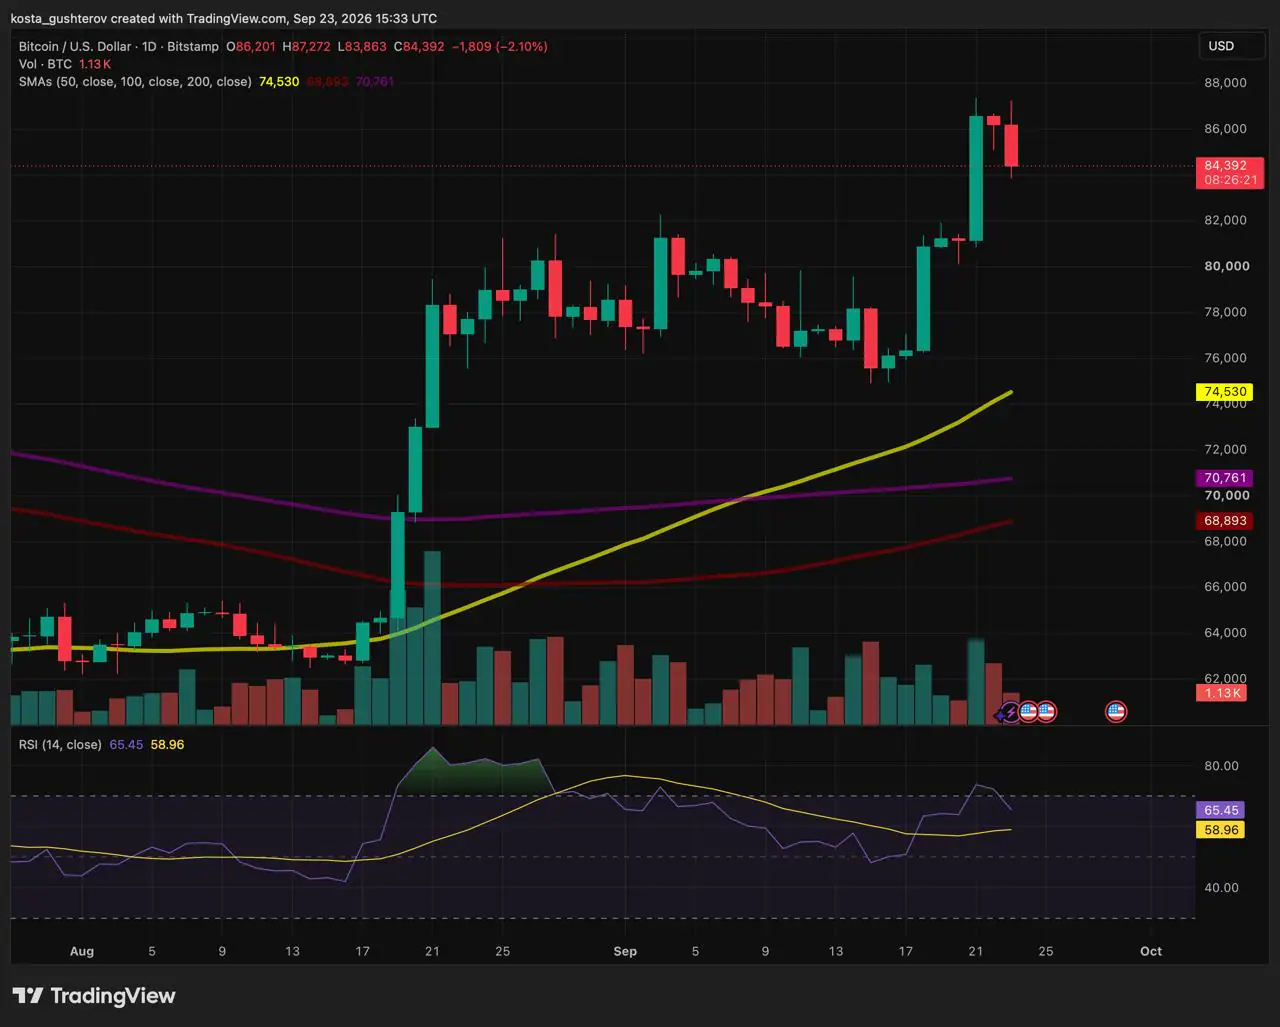
Short liquidations then added speed after Bitcoin cleared resistance. When an exchange liquidates a bearish position, it closes the trade through a buy-side transaction. If many shorts are closed during the same advance, those forced purchases can amplify a move that has already begun.
Barron’s cited an analyst estimate of approximately $650 million in crypto liquidations during the weekend squeeze. That figure covered positions across the market and should not be interpreted as $650 million in Bitcoin shorts alone.
Liquidation-driven buying is temporary because each short can be closed only once. Once that pressure fades, further gains require investors who are voluntarily willing to buy at the new price.
Our earlier examination of Bitcoin’s liquidation map found estimated cumulative short-liquidation leverage of approximately $575 million by $90,278. Bitcoin never reached that area. Its advance stopped at $87,374, leaving the larger concentration of estimated short exposure above the market.
Iran’s harder line brought oil risk back into focus
Oil initially extended its decline after US and Iranian representatives held their first talks in months. The possibility of diplomatic progress encouraged hopes that conditions affecting shipments through the Strait of Hormuz could improve.
Brent briefly traded near $98.30 and WTI near $89.50 on September 23, putting both benchmarks on course for a sixth consecutive decline, their longest losing run since August 2025.
The tone hardened later in the day. Iranian President Masoud Pezeshkian said Iran would not surrender to US pressure, according to The Independent’s live coverage.
Iran’s security chief separately said Washington would have to meet Tehran’s conditions before negotiations could resume. He also warned that the Strait of Hormuz would remain closed without US compliance. Those statements reduced confidence that the talks would quickly restore normal oil flows.
Crude later moved away from its session lows. At the time of writing, OilPrice.com showed WTI near $91.85 and Brent around $101.70.
The timing is consistent with traders restoring part of the supply-risk premium. It does not prove that the Iranian statements were the only cause of the rebound, because oil was also responding to changing shipment data, diplomacy and regional security risks.
Oil delivered two different signals
Earlier: The talks reduced immediate fears about prolonged disruption in the Strait of Hormuz.
Later: Iran’s conditions showed that talks remained far from an agreement capable of removing the supply risk.
Treasury yields made the backdrop less supportive
The oil rebound mattered beyond energy markets. More expensive crude can keep inflation elevated, potentially encouraging central banks to maintain higher interest rates for longer.
The Kobeissi Letter reported that the 30-year US Treasury yield had risen above 5.37% and was on course for its highest daily settlement since June 2004. The post connected the move with oil returning above $90 and renewed expectations for inflation and higher interest rates.
BREAKING: The US 30Y Note Yield rises above 5.37% and is now on track for its highest daily settlement since June 2004.
As oil prices push back above $90/barrel, both inflation and rate hike expectations continue to push higher.
The bond market is under serious pressure.
— The Kobeissi Letter (@KobeissiLetter) September 23, 2026
Higher Treasury yields increase the income available from government debt, giving investors a lower-volatility alternative to crypto. They can also tighten financial conditions and raise the opportunity cost of holding non-yielding assets such as Bitcoin.
The 30-year yield is not a direct Bitcoin pricing formula; crypto had already rallied while borrowing costs were high. However, rebounding oil and rising yields created a less favorable backdrop just as the forced buying from short liquidations was fading.
A 30% rally left room for profit-taking
Bitcoin had risen more than 30% from its August 19 level before reaching the latest high. Several altcoins advanced much faster: Ethereum gained nearly 6% in one 24-hour period while a group of altcoins recorded double-digit increases.
Those gains left earlier buyers with substantial profits to protect when the external backdrop became less favorable. Bitcoin’s rejection below $90,000, followed by rebounding oil and rising long-term yields, created plausible conditions for profit-taking.
Price data cannot identify each seller’s motive, so profit-taking remains an interpretation rather than a directly measurable total. The recent ETF inflows also argue against describing the retreat as a broad institutional exit.
Altcoins amplified the reversal. XRP fell about 5% from $1.60, compared with Bitcoin’s approximately 3.3% retreat from $87,374. XRP had also reached the same resistance area it crossed before its earlier move toward $1.70, giving traders a familiar level at which to reassess their positions.
What would separate a pullback from a failed breakout?
Crypto’s rally demonstrated that anticipated policy setbacks do not always cause immediate losses. The next test is whether voluntary buyers can defend the higher range now that short covering has faded and oil and Treasury yields are again working against risk appetite.
This article is provided for informational purposes only and does not constitute financial or investment advice. Cryptocurrency prices, ETF flows, derivatives positioning, oil prices and bond yields can change rapidly.

Kosta has reported on cryptocurrency markets and blockchain infrastructure since 2020, bringing over six years of hands-on experience in the crypto industry built through daily tracking of markets, trends, and emerging blockchain developments. Specializing in Bitcoin on-chain analysis, institutional ETF flows, and digital asset price action, his work at Coindoo has been cited by other news agencies and consistently covers market developments with a focus on data-driven reporting across Bitcoin, Ethereum, Solana, and XRP.
Over the years, Kosta has contributed to multiple crypto media outlets in different regions, authoring over 6,000 articles across the sector. His reporting spans cryptocurrency markets and the broader fintech industry, tracking not only price action but also the technological and regulatory forces shaping the ecosystem.
To support his analysis, Kosta actively leverages on-chain data and metrics from leading platforms such as Santiment, Glassnode, and CryptoQuant, enabling deeper, evidence-based market insights. He believes in the power of transparency and the data that underpins the blockchain ecosystem.
His academic background in Marketing Management from Denmark further complements his analytical approach, adding a strong understanding of communication strategy and content positioning to his work.



Be the first to comment