


Siren [SIREN] may be approaching a rebound despite heavy capital outflows. The token fell 14% over the past day, leaving momentum firmly bearish in the short term.
Liquidation data highlighted that weakness. Long traders lost $172,000, compared to just $22,000 in short liquidations. Even so, buyers continued adding long exposure despite the losses.
What do SIREN momentum indicators suggest?
Momentum indicators pointed to improving bullish sentiment.
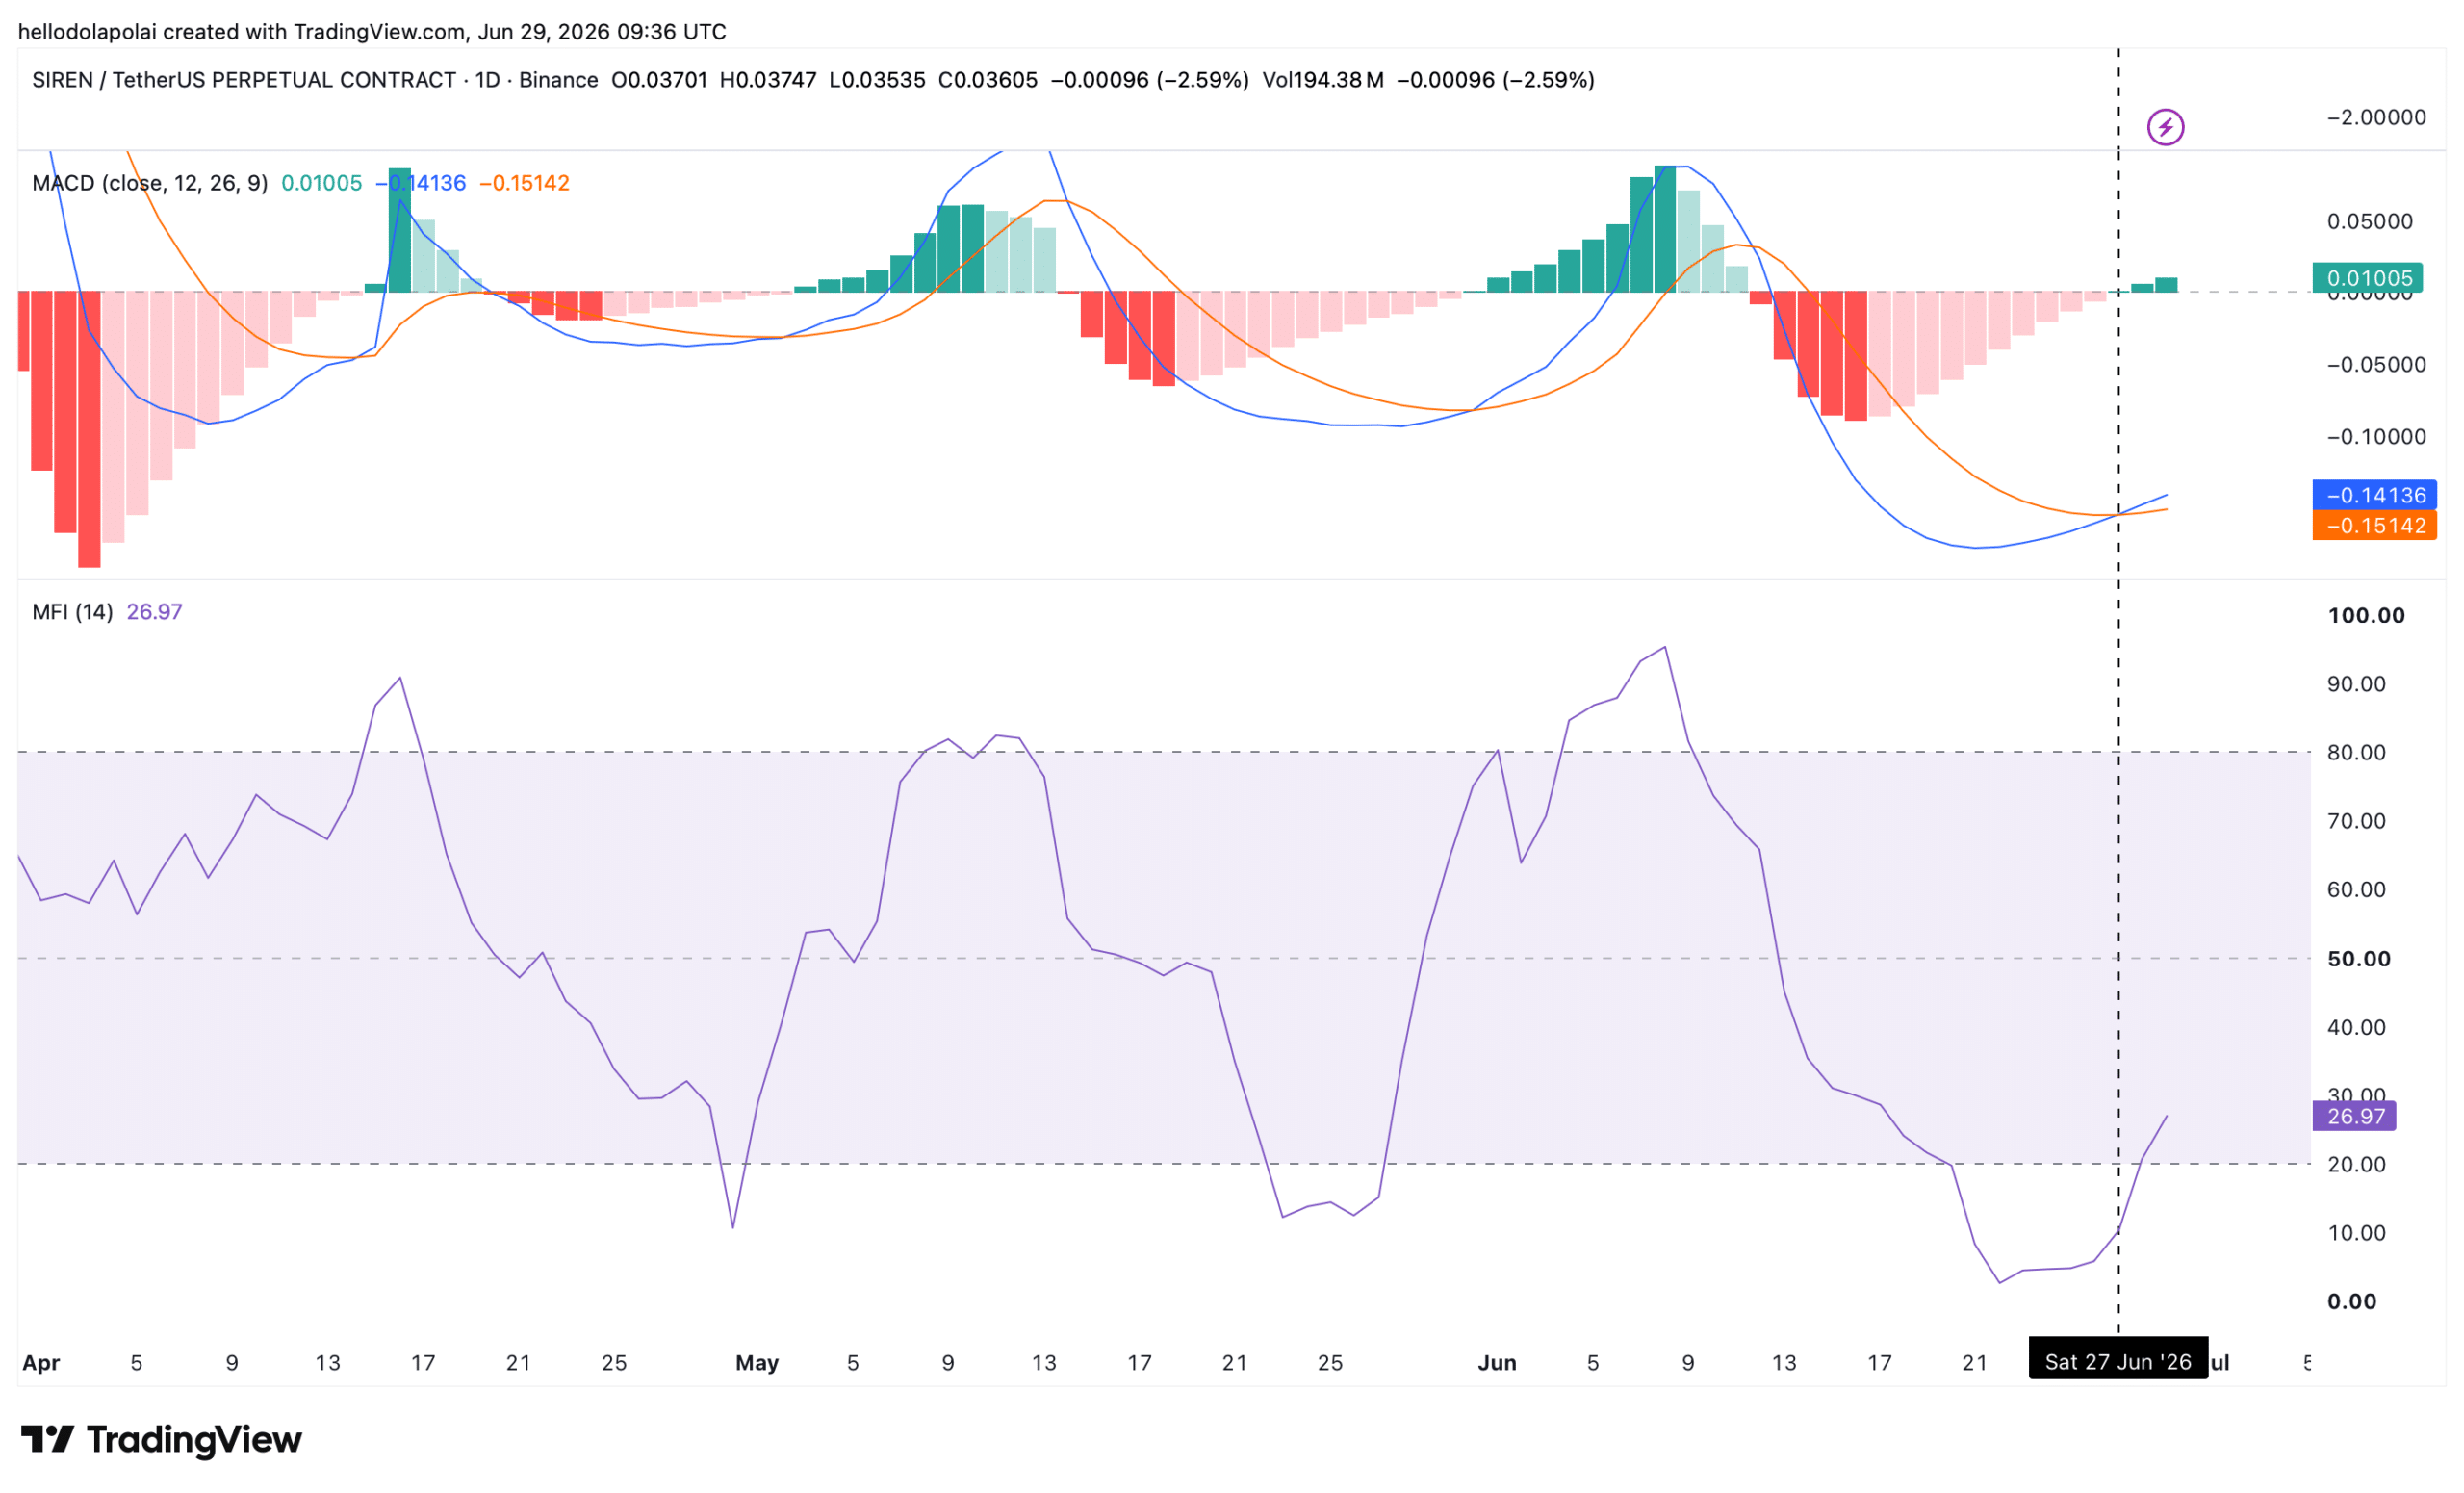
The Moving Average Convergence Divergence (MACD), which measures trend momentum, flashed an early bullish crossover on the 27th of June. The MACD line crossed above the signal line, suggesting buyers were beginning to regain strength.

That move aligned with improving capital flows.
The Money Flow Index (MFI), which tracks buying and selling pressure, rebounded after falling below the oversold threshold of 20.
The indicator has since climbed to around 38 and continued moving higher, suggesting fresh capital was returning to SIREN.
Are traders still betting on higher prices?
Despite heavy losses among long traders, market positioning remained tilted toward the bullish side.
Funding Rates stayed positive at 0.0951% at press time, indicating traders continued paying a premium to maintain long positions.
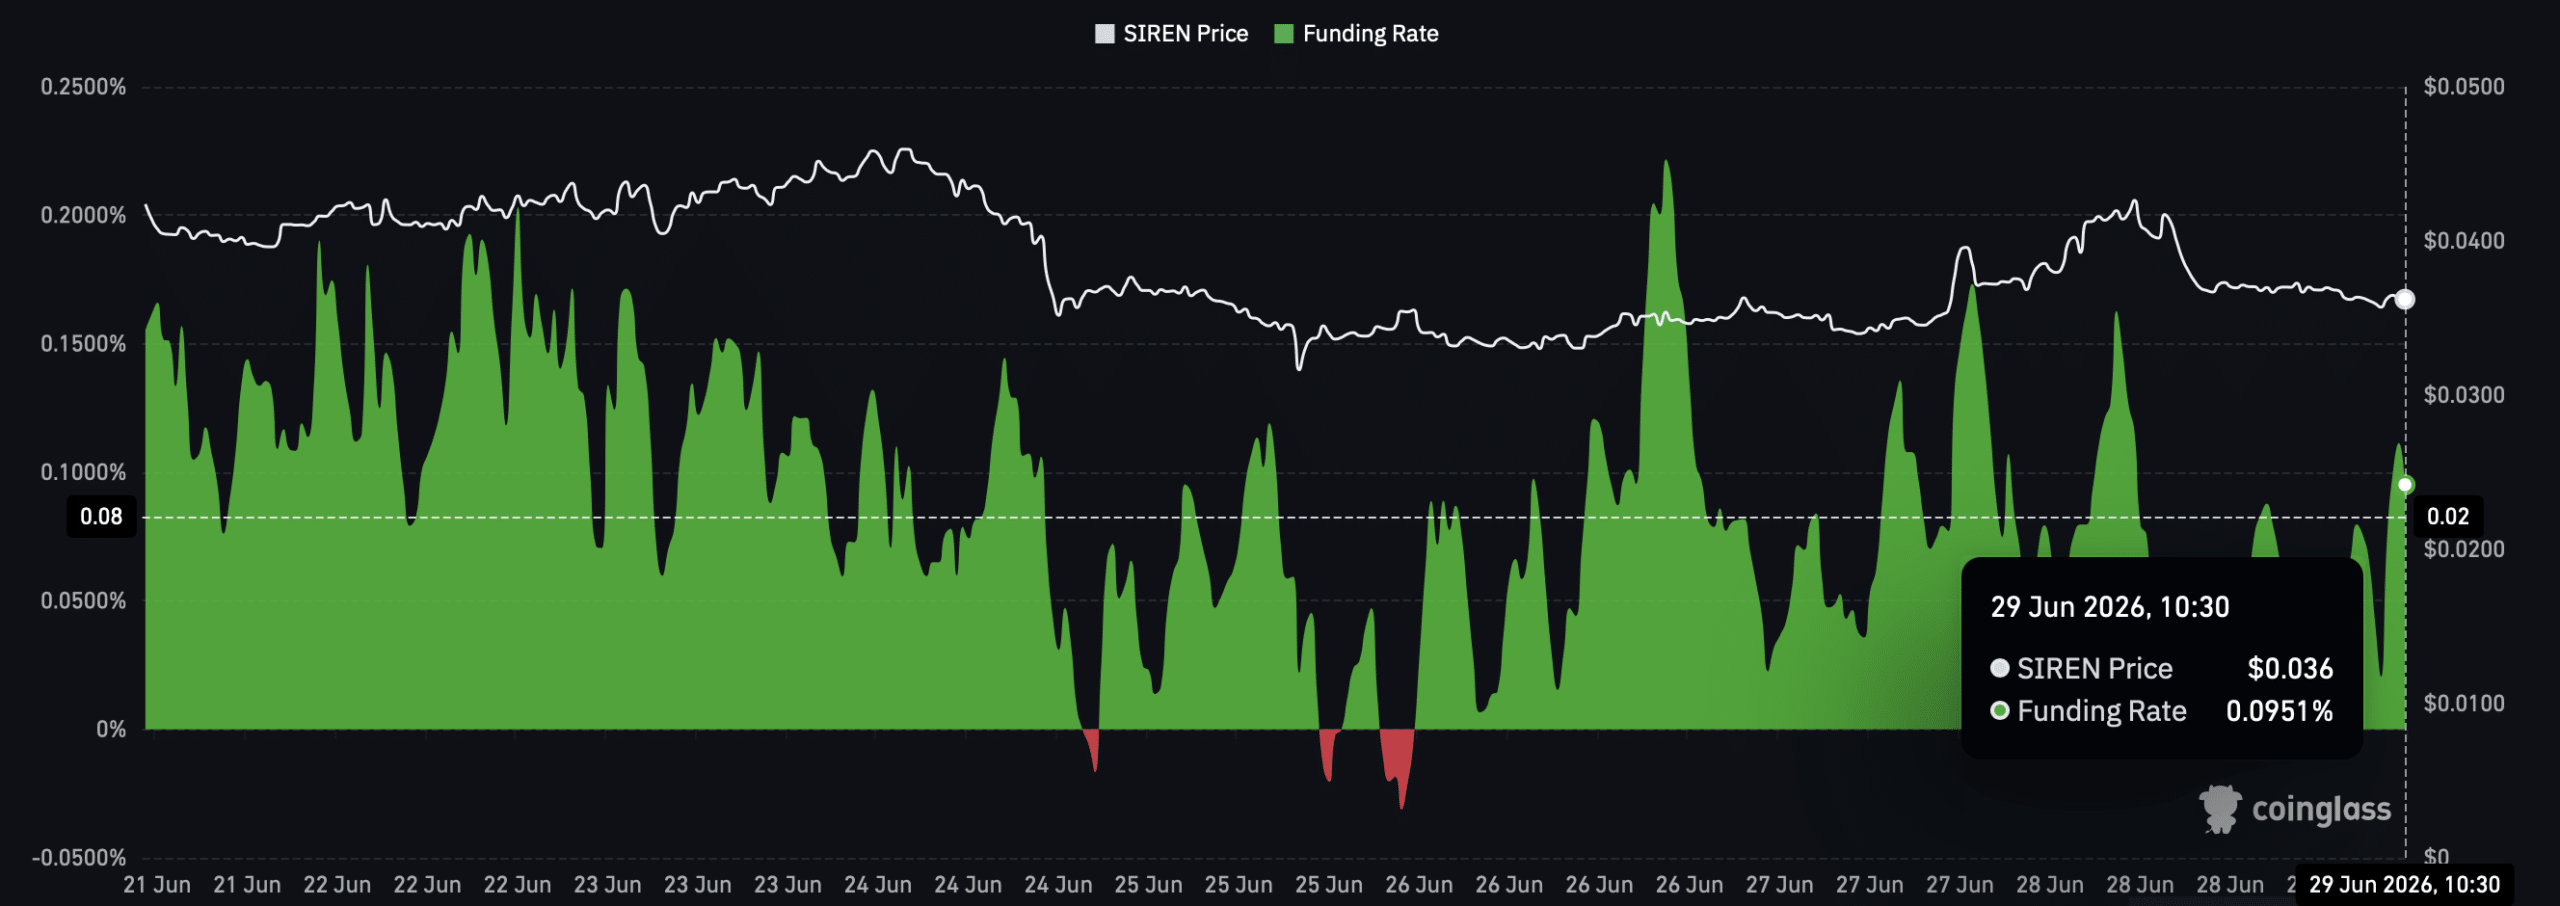
The positive Funding Rates suggested bullish conviction persisted despite the recent decline.
However, Open Interest dropped 15% to $35.97 million, reflecting reduced participation after the sell-off. Even so, the remaining positions remained largely long-biased, which could support a recovery if buying demand strengthens.
Where could SIREN move next?
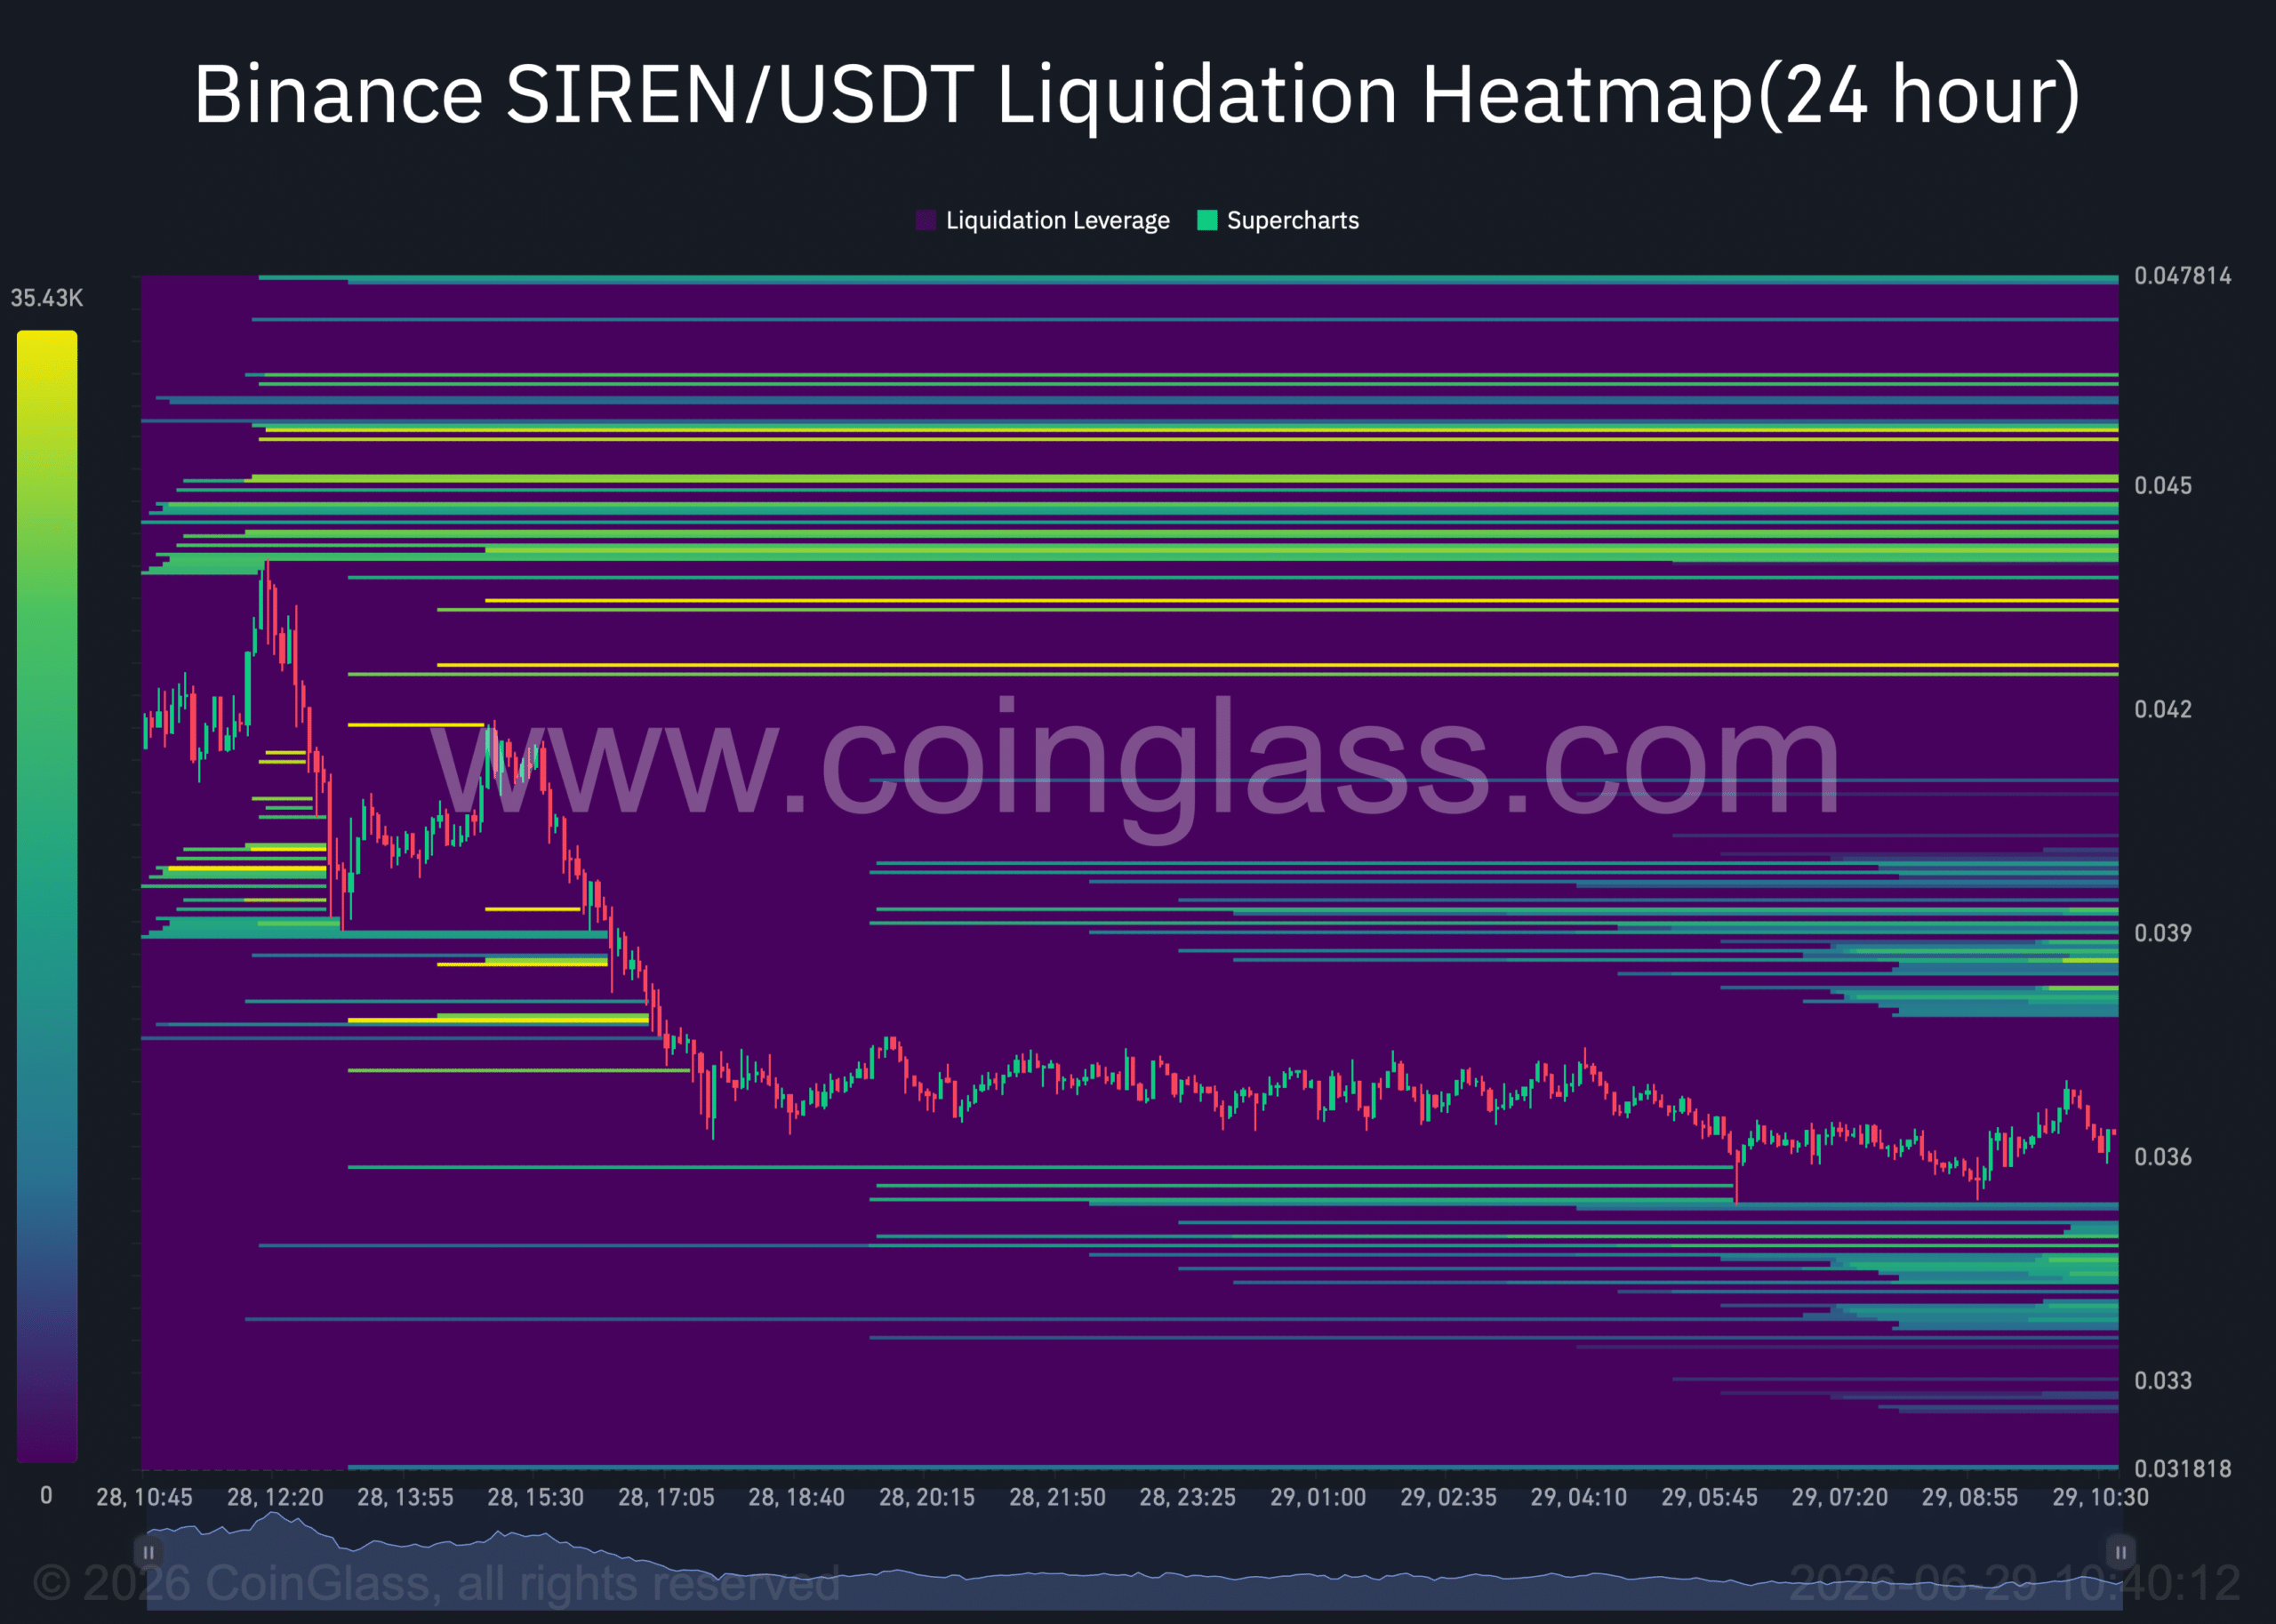
The Liquidation Heatmap highlighted several liquidity clusters above the current price.
Those clusters often attract price movement as markets seek liquidity. That left room for SIREN to attempt a move higher if buyers maintained momentum.
On top of that, improving capital flows and bullish momentum indicators supported the possibility of a short-term recovery.
Even so, price confirmation remained necessary before a sustained reversal could be established.
Final Summary
- SIREN fell 14%, with long traders absorbing most liquidation losses during the sell-off.
- Even so, MACD, MFI, positive Funding Rates, and overhead liquidity clusters suggested a rebound could still develop if buyers regained control.


Be the first to comment