


The crypto market selloff continues into the June 2 session with Bitcoin trading at $68,000, down 4.54% over the past 24 hours and 11.59% on the week. Ethereum holds at $1,940, posting a 1.19% daily decline and 8.22% weekly loss. XRP trades at $1.23, off 3.47% on the day and 8.29% over seven days. Solana sits at $77.49, down 2.62% in 24 hours and 9.01% on the week. BNB stands as the lone outlier among majors, printing $674.87 with a modest 0.25% gain on the day and a 1.96% weekly advance.
Key Takeaways
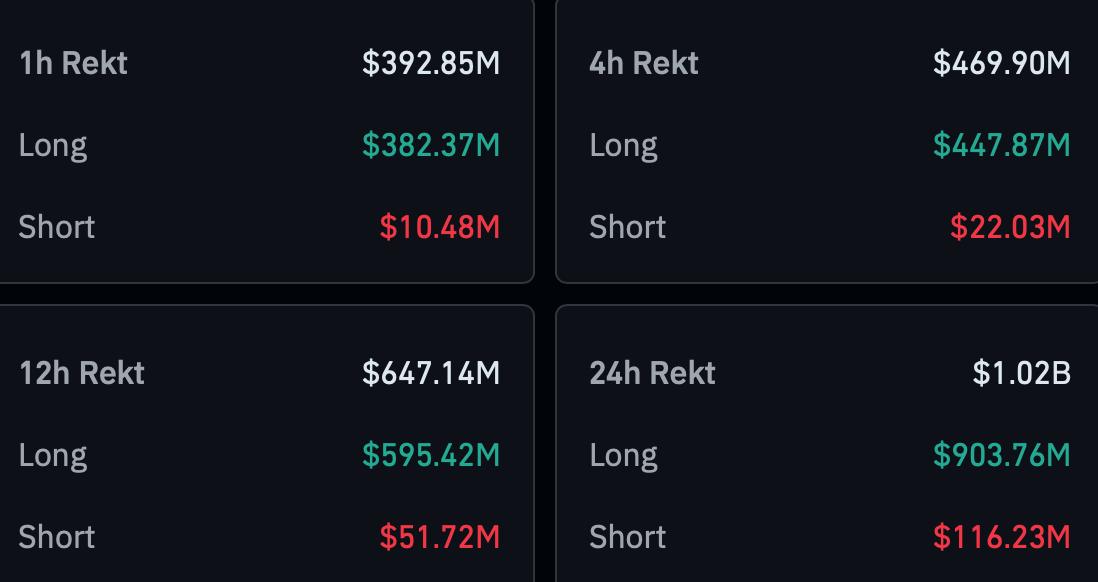
- Derivatives Capitulation: CoinGlass confirms $1.02B in total crypto futures liquidations.
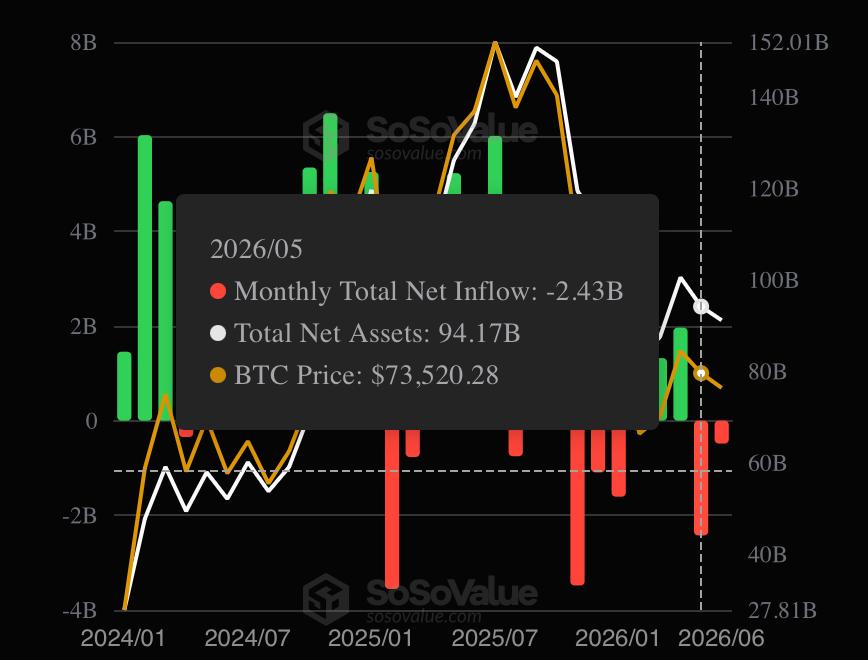
- Institutional Flow Contraction: SoSoValue tracks severe -$2.43B monthly ETF outflows.
- Supply Liquidity Overhang: Arkham verifies $739M Mt. Gox Bitcoin transfers.
- Corporate Treasury Shift: Strategy executes first Bitcoin sale since 2022.
- Global Macro Headwinds: Geopolitical risk-off sentiment accelerates broad market selling.
Strategy’s First Bitcoin Sale in Three and a Half Years
Strategy (formerly MicroStrategy) disclosed in an SEC filing on June 2 that it sold 32 Bitcoin for approximately $2.5M. Against its 843,706 BTC holdings, the sale is financially negligible. Its market impact was not.
Strategy has functioned since 2020 as the benchmark institutional holder, the entity whose continued accumulation signaled that the smartest corporate capital remained net long Bitcoin regardless of price. The June 2 filing marked the company’s first Bitcoin sale in three and a half years. That context may have transformed a routine treasury adjustment into a psychological inflection point. Market participants who had priced in Strategy’s accumulation posture could have repriced that assumption on the disclosure, possibly contributing to a move that was already developing from multiple independent pressure points.
$1.02B in Futures Liquidations Across 24 Hours
The liquidation sequence did not begin at $70,000. CoinGlass data suggests the cascade likely initiated as BTC broke below $71,000, where the first wave of automated margin calls may have begun clearing overleveraged long positions. The move accelerated materially after price breached $70,000, a level where historical positioning data shows derivative concentration tends to amplify directional moves beyond what spot selling alone produces.
With BTC now at $68,900, the market is contesting the $68,000 level in real time. Whether that level holds as support or flips into resistance by the end of the June 2 session is one of the most important structural question of the day. A daily close above $68,000 could suggest the liquidation cascade has exhausted the most leveraged long exposure and that a stabilization attempt is possible. A close below it would imply the level has flipped to resistance, leaving the $65,000–$66,000 January 2026 correction low as the next reference point with no confirmed demand zone in between.
CoinGlass tracking data confirms $904M in long positions were forcibly closed within the 24-hour window, with total liquidations across both sides reaching $1.02B.
Mt. Gox Moves $739M in BTC Ahead of Distribution Deadline
Arkham Intelligence confirmed that the Mt. Gox estate transferred 10,422 BTC, valued at approximately $739M at time of transfer, to two new wallet addresses. The move coincides with the estate’s approaching creditor distribution deadline.
The transfer does not confirm immediate open-market selling. Coins moving between wallet addresses within the estate’s control could reflect internal preparation rather than imminent exchange deposits. What the market appears to be pricing is the probability: with a hard deadline approaching and 10,422 BTC representing a meaningful supply overhang, the fear of creditor distribution hitting exchanges may be compounding existing sell-side pressure in a way that does not require the coins to actually move to have price impact. The perception of incoming supply is possibly functioning as supply itself.
May ETF Outflows Hit $2.43B, the Worst Month of 2026
SoSoValue data confirms U.S. spot Bitcoin ETF products registered a monthly total net inflow of -$2.43B in May 2026, the deepest monthly outflow reading of the year. Total net assets across the ETF complex contracted to $94.17B, down sharply from the peak above $150B recorded during the cycle highs. BlackRock’s IBIT and Fidelity’s FBTC recorded the heaviest individual outflows across the month.
The May figure suggests a structural deterioration in institutional appetite rather than a single-session reaction. A $2.43B net outflow sustained across a full calendar month could reflect a deliberate reallocation decision by institutional participants rather than panic selling. That distinction matters because selling pressure of this nature is unlikely to reverse on a single positive catalyst. Institutional capital that exited through ETF redemptions over 30 days would likely require a sustained change in market structure to return.
The Macro Layer: U.S.-Iran Tensions Add a Risk-Off Dimension
On top of all that, a breakdown in U.S.-Iran war negotiations on June 2 pushed global markets into a broad risk-off posture. Bitcoin, which has increasingly traded as a risk asset rather than a safe haven during periods of acute geopolitical stress, sold off alongside equities as traders reduced exposure across speculative positions. The geopolitical development did not initiate the June 2 move but could have compounded it, possibly removing a macro tailwind that a stable diplomatic environment might have provided against the crypto-specific pressure already building from the three triggers above.
What makes the June 2 move structurally different from a routine correction is the convergence. Any one of these triggers in isolation could have produced a contained, recoverable selloff. But arriving simultaneously, each one activated a different investor group with a different risk threshold and a different reason to reduce exposure. With sentiment already fragile, that simultaneous pressure across multiple participant types could have been enough to shift a manageable pullback into a broader, faster drawdown than any single catalyst would likely have generated alone.
The information provided in this article is for educational purposes only and does not constitute financial, investment, or trading advice. Coindoo.com does not endorse or recommend any specific investment strategy or cryptocurrency. Always conduct your own research and consult with a licensed financial advisor before making any investment decisions.

Be the first to comment