


What to know:
- XRP holds near $1.40 as traders watch $1.80 resistance for trend confirmation.
- CoinGlass data shows XRP futures volume rising as open interest reaches $2.61B.
- The RSI and MACD readings show weak momentum despite mild daily price gains.

XRP price action remained steady on Tuesday, May 5, as traders monitored a critical technical phase. The asset showed limited movement despite slight gains. Market signals stayed mixed, reflecting uncertainty in short-term direction.
As of writing, XRP is trading at $1.40, showing a 0.64% rise in the past day. The trading volume is down by 7.88% and is currently standing at $1.93 billion. Over the last week, the XRP coin price has gone up by 1.25%, according to CoinMarketCap.
Also Read: Pump.fun (PUMP) Bullish Consolidation Signals Potential Breakout to $0.0034

XRP Enters Key Decision Zone
Analyst Egrag Crypto highlighted that XRP is not in a confirmed trend. He termed the existing structure a decision zone. In his opinion, the same bearish pattern might represent a bullish pattern when considered in a different manner. The price is still squeezed around the 100 EMA.
The analyst identified $1.80 as a key resistance level. A break and close beyond this line may change the trend. In this instance, XRP could advance to $3.20. The measured move might increase to $11.50 in case strength persists.

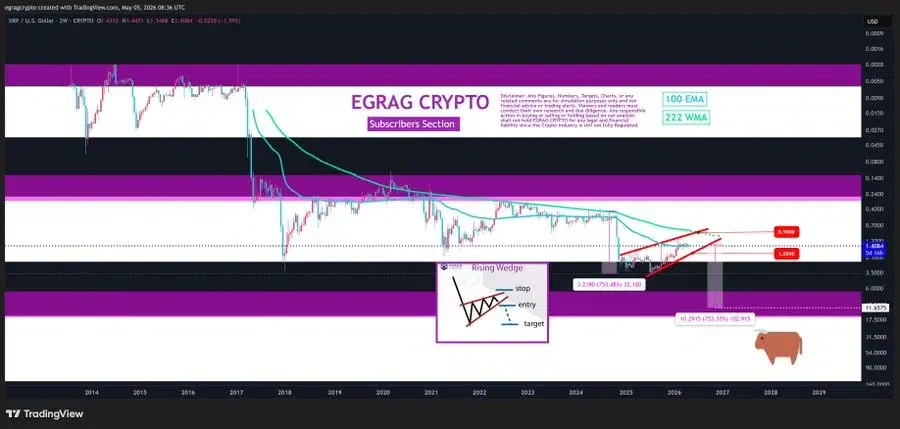
On the negative side, there is still the possibility of a bearish case. Before any reversal, price may retrace to the level of $0.90. The analyst has mentioned that there could be a liquidity sweep in the zone. He also pointed to interaction with the 222-week moving average in past cycles.
XRP Funding Rate Shows Positive Bias
Derivatives data showed increased participation. According to CoinGlass data, the future volume increased by 6.68% to $3.30 billion. Open interest climbed 3.17% to $2.61 billion. The OI-weighted funding rate was estimated at 0.0076%, which implies a mildly positive bias.
RSI and MACD Show Weak Momentum
From a technical perspective, the Relative Strength Index (RSI) data reflected neutral market conditions. The RSI is at 51.74 with its moving average at 50.69. Both values have remained near the 50 mark.
This implies weak purchasing power, yet not the force to validate a good bullish trend. XRP did not break above the overbought region, and this indicated that momentum remained in control.
The Moving Average Convergence Divergence (MACD) data indicated no high momentum. The MACD line is at 0.00039, while the signal line reached 0.00327.
The histogram remained negative at -0.00287. This structure showed that there is no full development of the bullish momentum.
XRP continues to trade within a tight range. The market has not been assured of any definite direction. Analysts underline the significance of key levels. Traders are still concerned with price action around resistance and support areas.
This article contains market analysis and price predictions. These are not guarantees. Crypto markets are volatile. Always DYOR. Not financial advice.
Also Read: Litecoin (LTC) Holds Range as Accumulation Signals Possible $500 Breakout

Be the first to comment