

Bitcoin (BTC) hit $64,000 after Friday’s Wall Street open while analysis warned of “unreliable” BTC price support.
Key points:
- Bitcoin hits local highs during the US trading session as US-Iran peace hopes offer modest risk-asset relief.
- SpaceX looks set to launch the largest IPO ever witnessed,
- BTC price concerns linger over the ability of a key trend line to hold as support.
Crypto, risk assets “shrug off” inflation headwinds
Data from TradingView showed BTC/USD retaining gains as crypto and risk-asset markets surfed mixed signals over a US-Iran peace deal.
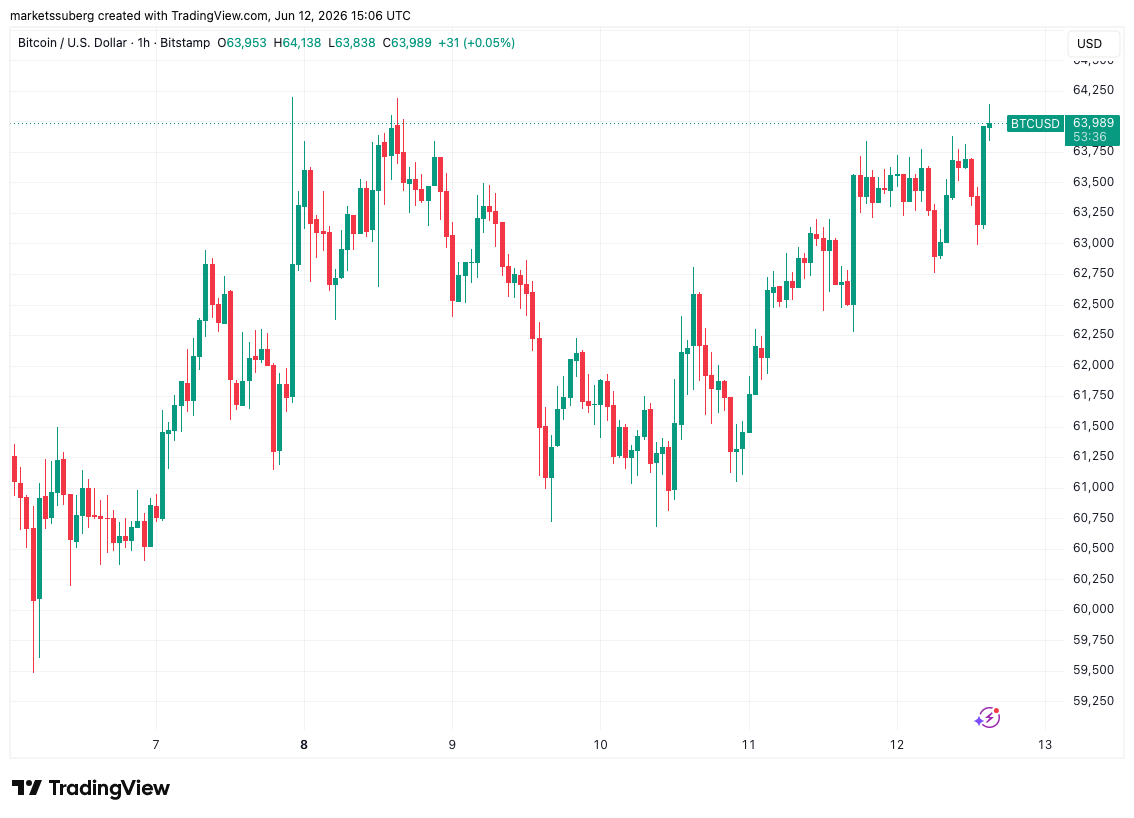
BTC/USD one-hour chart. Source: Cointelegraph/TradingView

At the time of writing, there was no official information about whether a deal would go ahead, with US President Donald Trump rebutting details from the Iranian side.
“What they said, including their weak and pathetic statement on having a deal, bears no relation to the truth,” he wrote in his latest post on Truth Social.

Source: Truth Social
Stocks opted to tread water at the US open on the day that SpaceX launched the biggest initial public offering (IPO) in history. Shares were slated to debut at $170 — $45 above the initial IPO price.
In a fresh analysis, trading resource Mosaic Asset Company said that markets now faced a combination of a strong labor market and high inflation.
“While equity markets seemed to shrug off inflation fears and the impact to valuations and monetary policy, better economic data is giving the average stock a reason to rally,” it summarized in its latest Mosaic Chart Alerts update.
“While some of the air is being released from the massive rally in AI infrastructure stocks, laggards off the late March lows are turning up recently.”
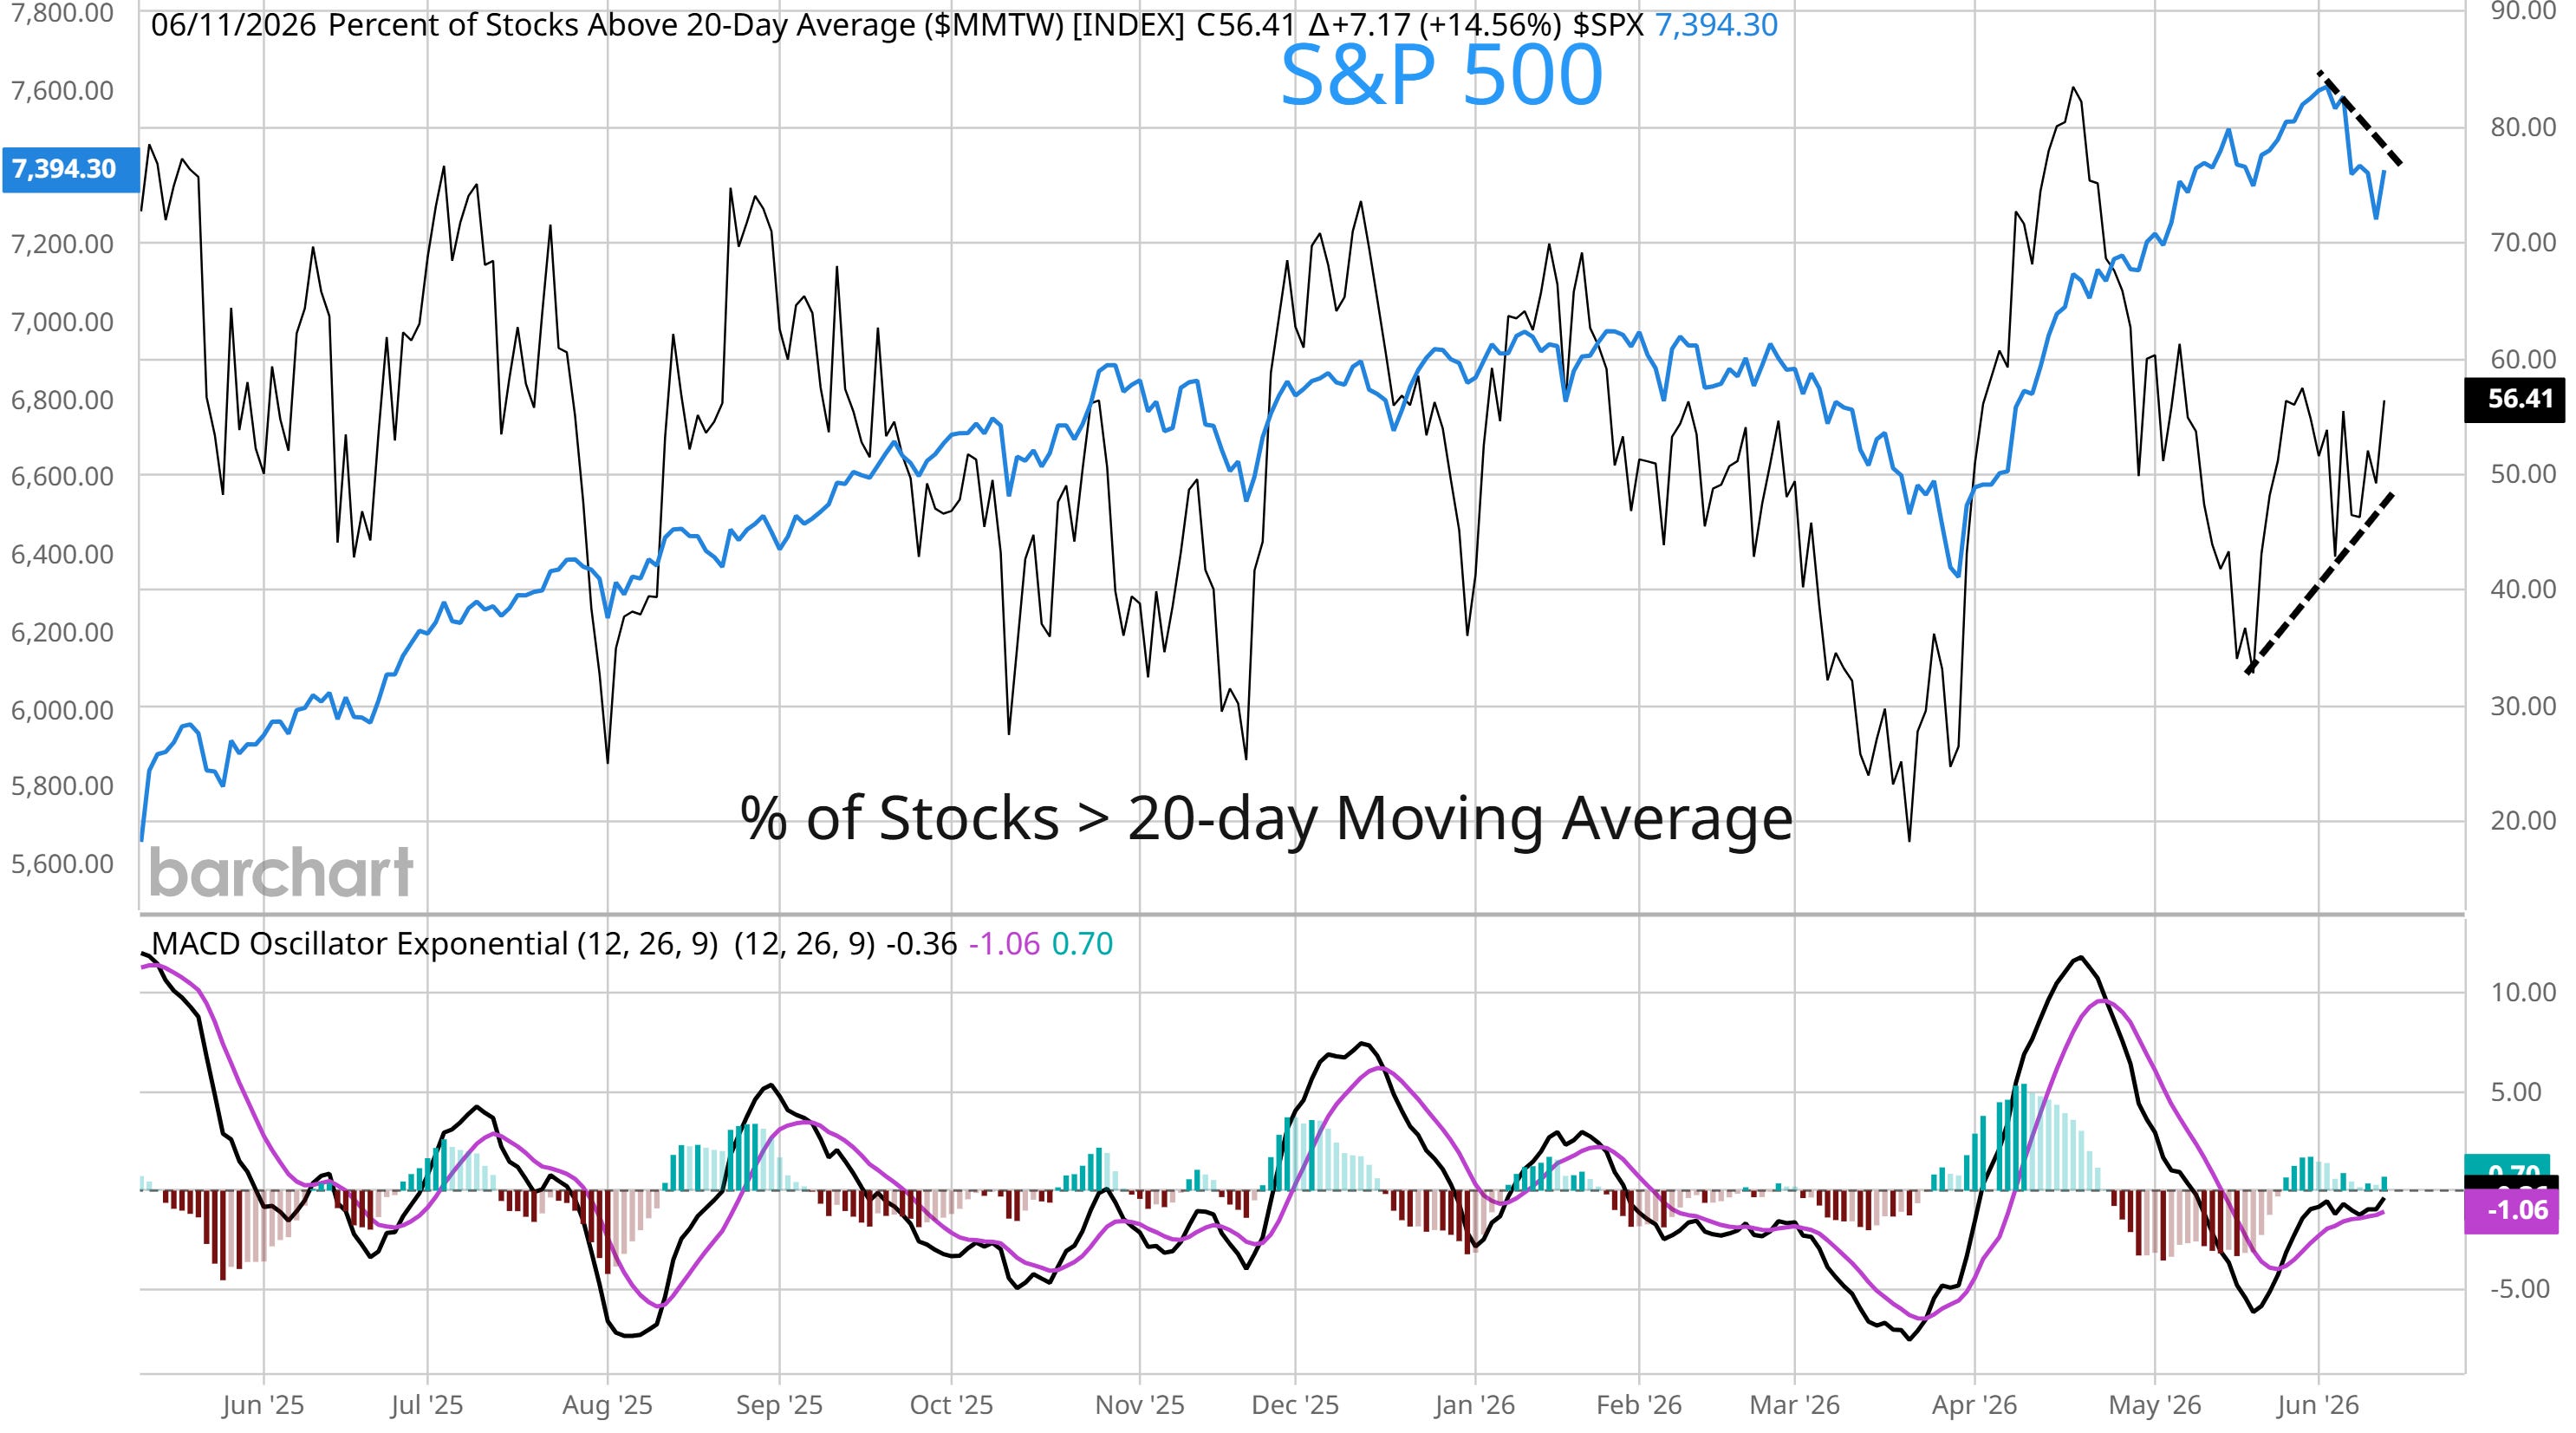
S&P 500 chart data. Source: Mosaic Asset Company
As Cointelegraph reported, this week’s US inflation data set new multi-year records on the back of the US-Iran war and its impact on oil prices.
BTC price 200-week trend line in focus
While Bitcoin saw new local highs near $64,000, market participants remained highly cautious on the outlook.
Related: Bitcoin miner ‘capitulation’ comes as trader sees later 2026 bear-market bottom
Trader and analyst Rekt Capital was suspicious of a long-term trend line holding up price — the 200-week simple moving average (SMA) at $62,025.
“Bitcoin is currently treating the 200-week SMA as support. But this SMA has historically proven to be an unreliable support, with price breaking down from it over time,” he warned X followers.
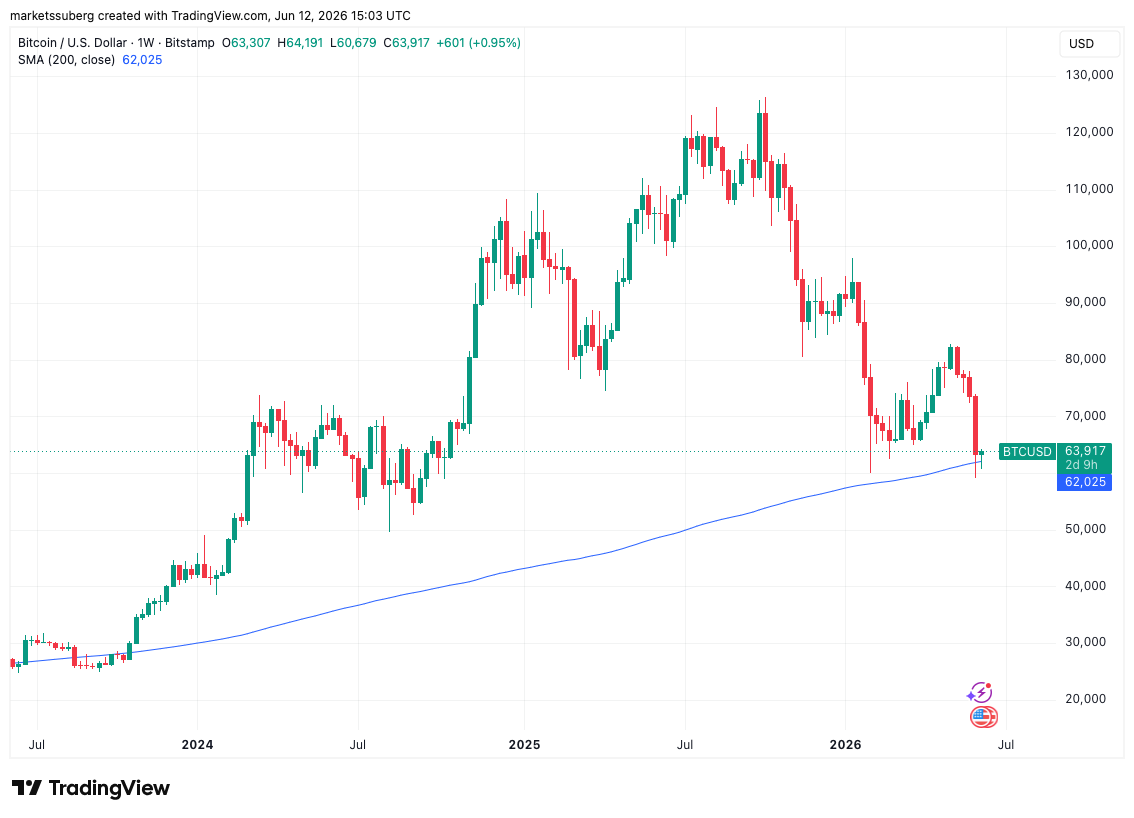
BTC/USD one-week chart with 200SMA. Source: Cointelegraph/TradingView
Rekt Capital saw additional friction coming from the fact that BTC/USD had dropped below old all-time highs from 2021.
“This deviation below old All Time Highs for Bitcoin tends to take months to fully develop to ultimately form a Bear Market bottom,” he commented.
“Though Bitcoin has deviated -14% below old ATHs thus far, this process is still technically ongoing and will be for a while.”
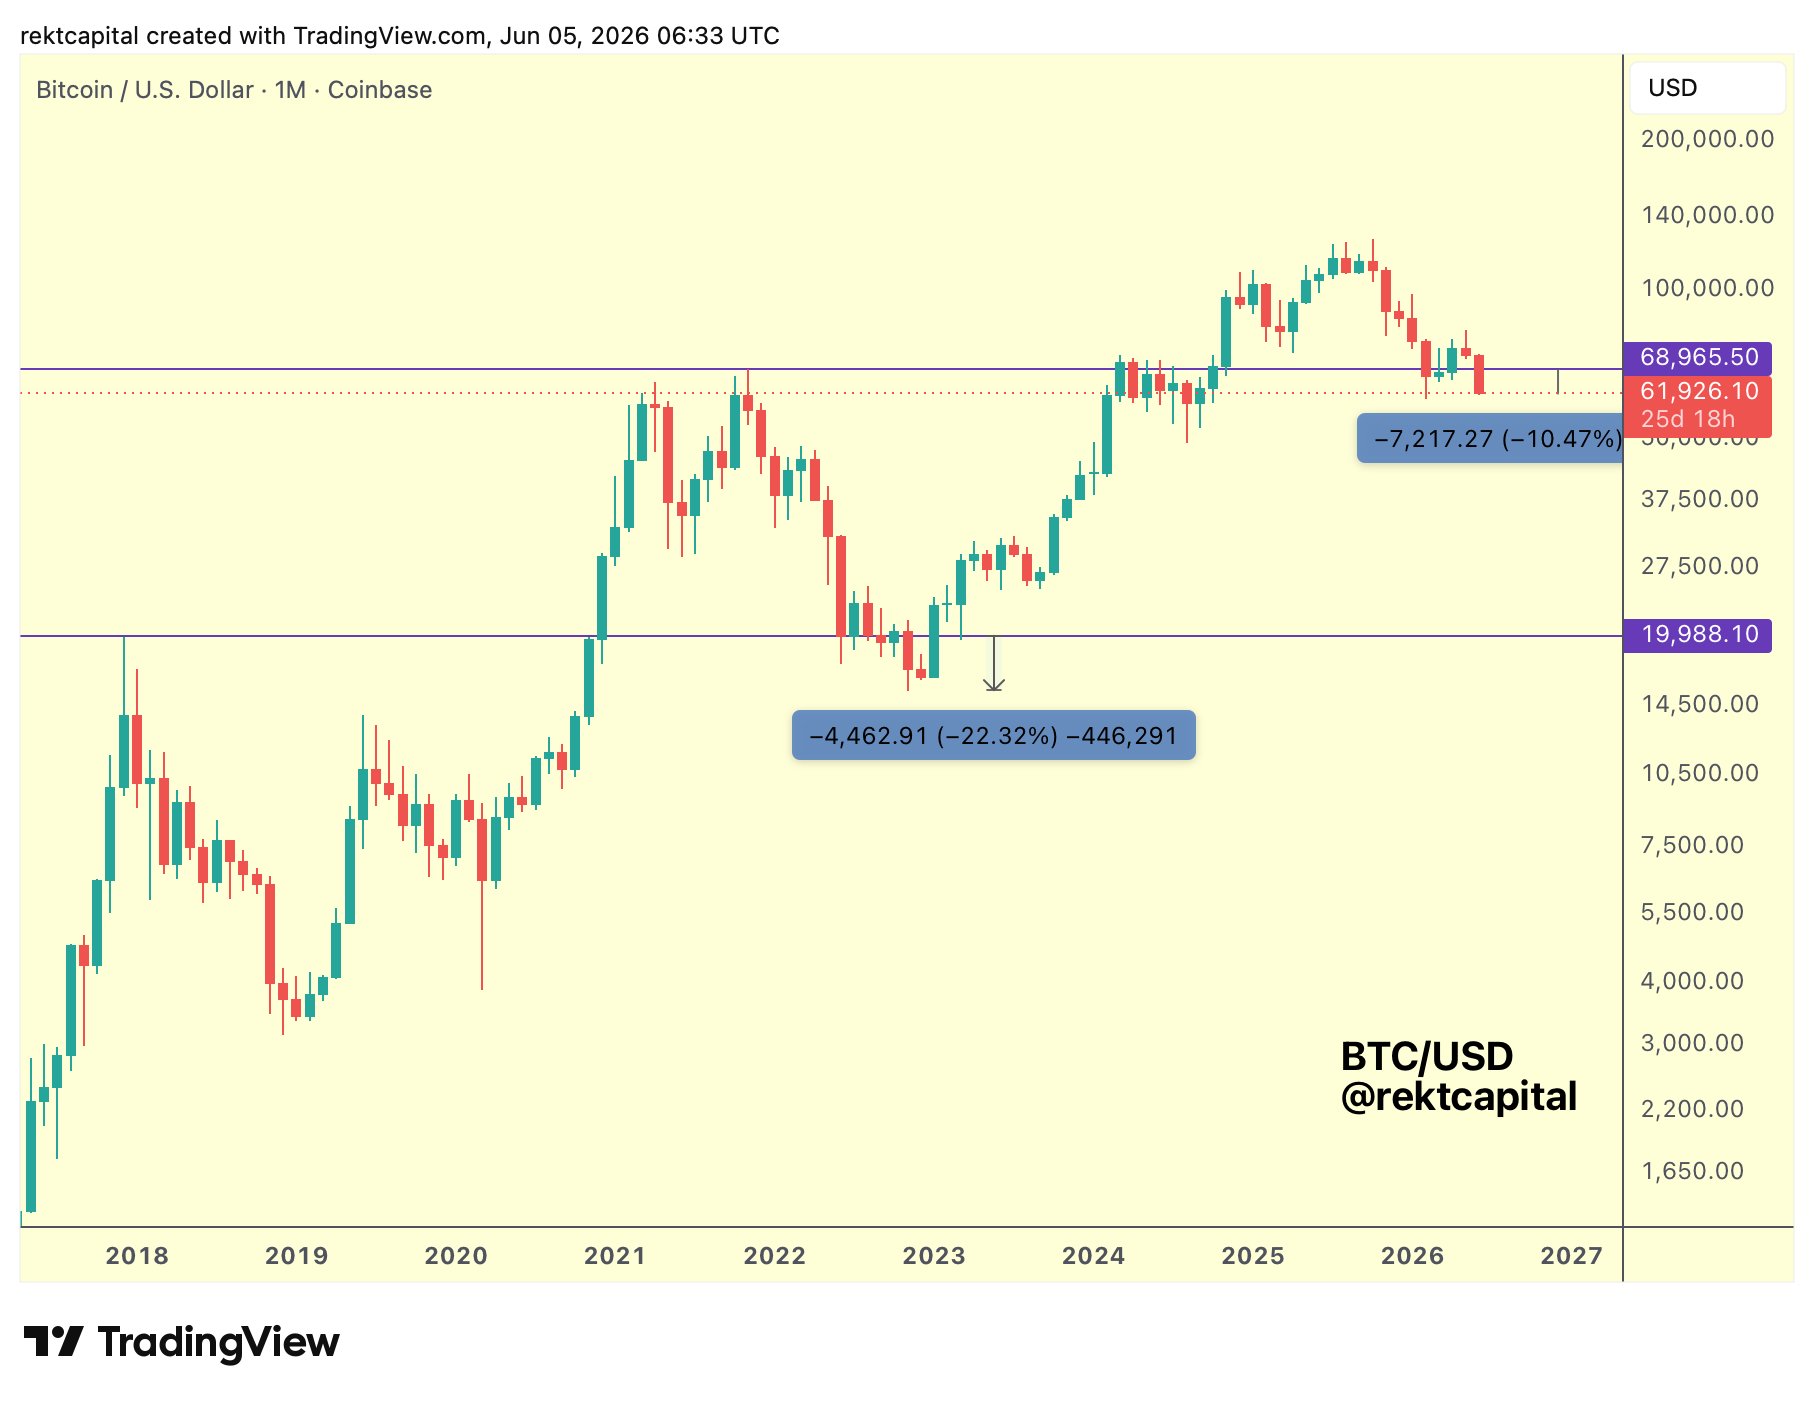
BTC/USD one-month chart. Source: Rekt Capital/X

Be the first to comment