


Ethereum is headed for a potentially significant moving-average crossover, but it is still below resistance as the emerging golden-cross setup arrives. Ethereum’s recovery structure may be strengthened by the signal, but price must first do some of the necessary work to generate it.
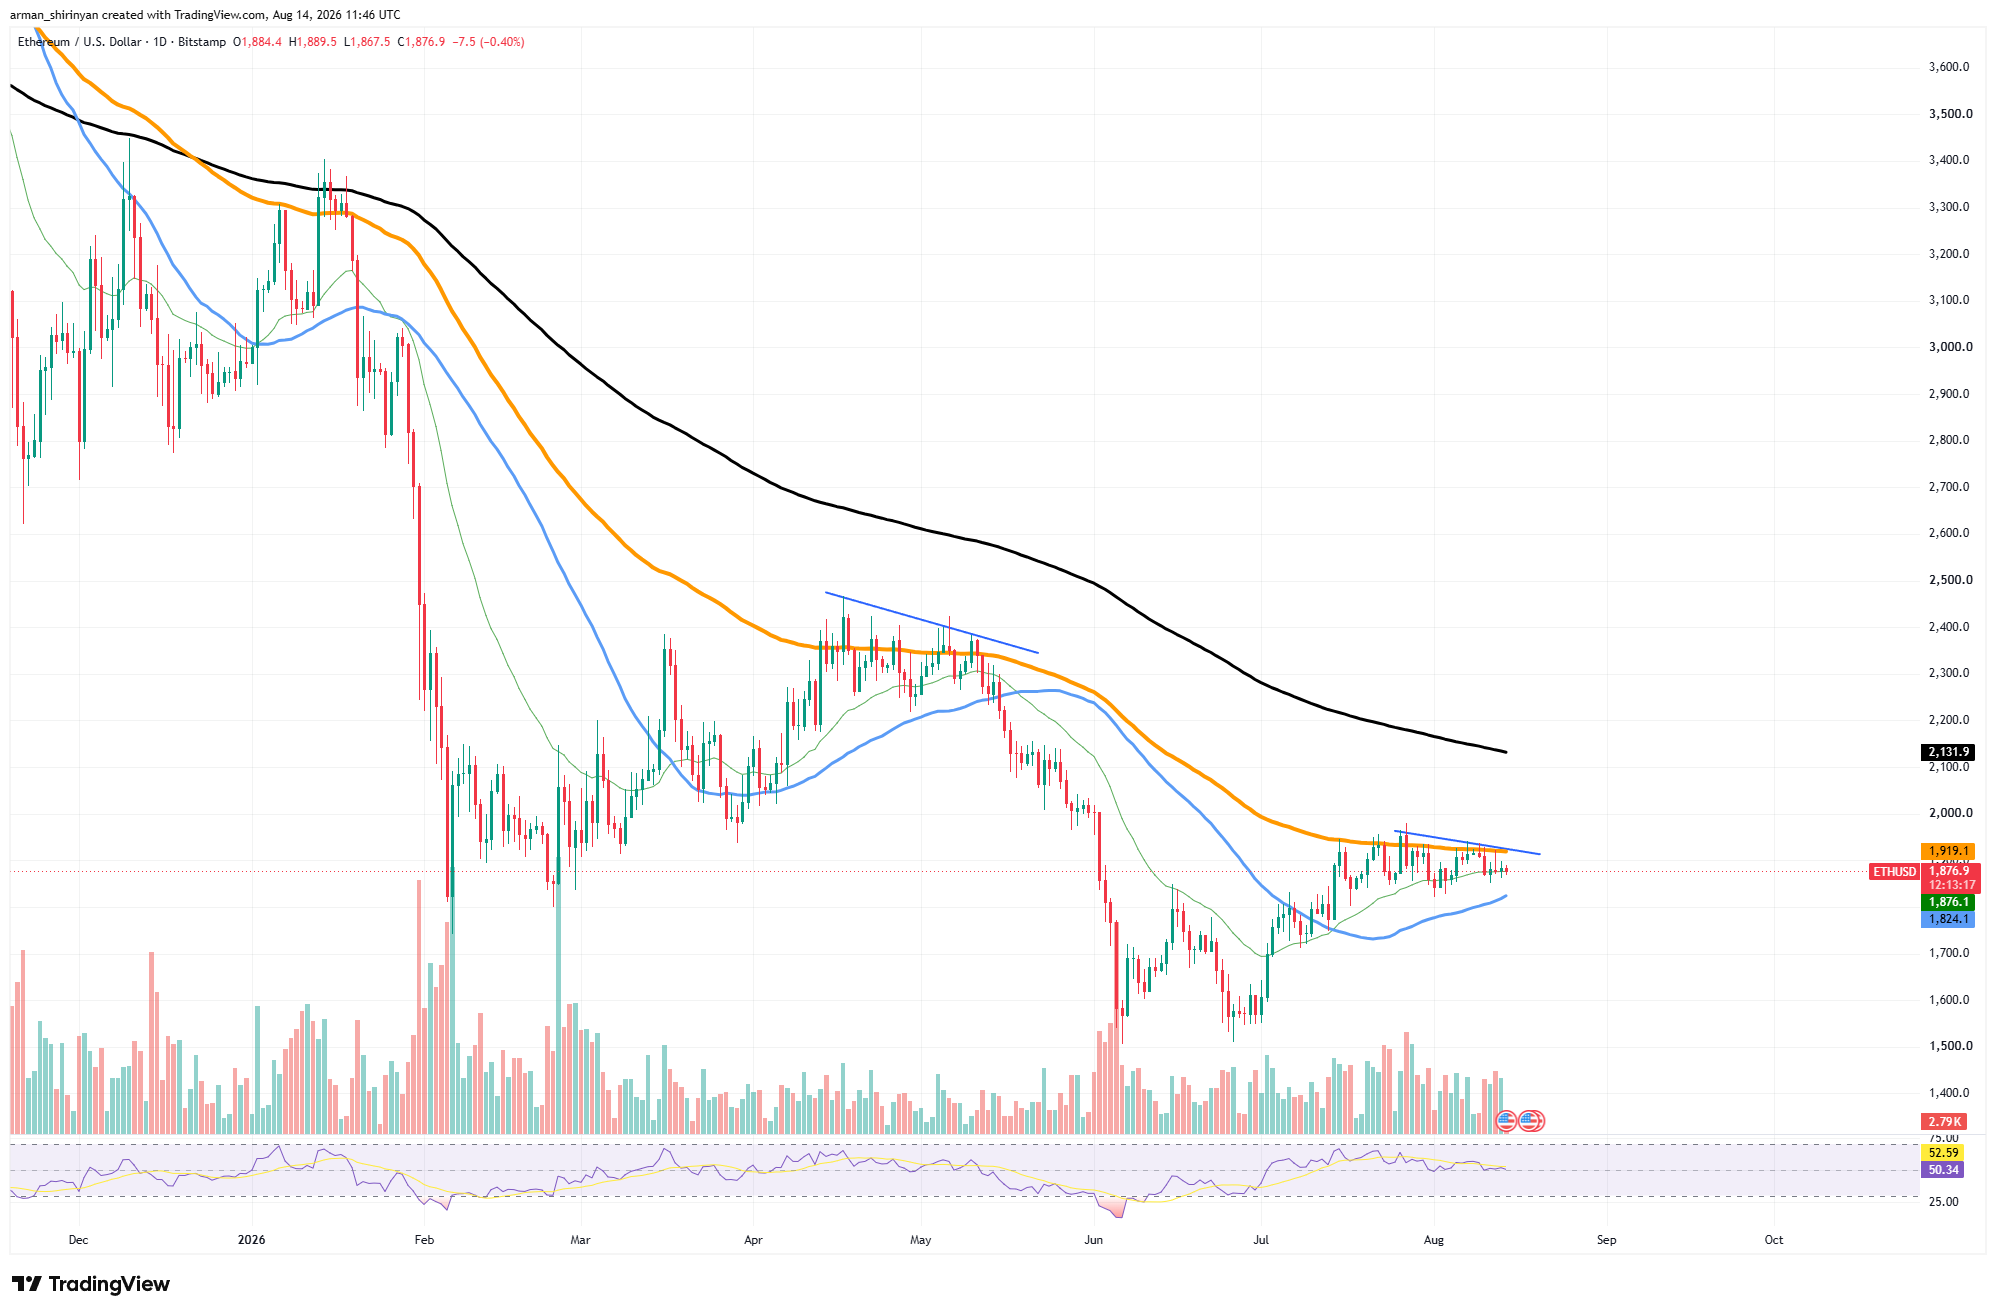
Right now, ETH is trading at about $1,874. While the 100-day moving average is still falling, close to $1,919, the 50-day moving average has turned upward and is now at about $1,824. As a result, there is less space between them in both directions. A bullish golden-cross configuration would be produced by Ethereum if the 50-day average eventually crossed above the 100-day average.
These crossovers show that the more recent price performance has surpassed the slower average, which represents the longer-term trend. The issue is that golden crosses are lagging indicators. Instead of raising the price, they validate an improvement that has already taken place.

Therefore, in order for the crossover to occur, ETH must continue its recovery. That’s not a given. Since July, Ethereum has frequently struggled between $1,900 and $1,950. Additionally, a descending resistance line has formed across the most recent local highs, creating an additional barrier in the same area.
Clear breakout being formed
This region is made even more significant by the 100-day moving average at $1,919. As a result, a clear breakout above $1,920–$1,950 would enhance Ethereum’s current price structure and raise the likelihood that the 50-day average will complete its crossover. At the moment, momentum gives neither side much of an advantage.
After cooling from higher readings earlier in the recovery, RSI is currently at about 49.8, which is nearly perfectly neutral. The downside risk is still comparatively clear. The first significant support comes from the rising 50-day average at $1,824. Losing it could result in exposure to the $1,750–$1,800 range and a significant delay in the crossover.
Ethereum would still have to contend with its 200-day moving average at $2,132 even if the golden cross materialized. That continues to be a much bigger test of the long-term trend. As a result, the developing crossover is positive, but it should not be interpreted as an automatic bullish trigger.
However, the resistance must be broken first by Ethereum. Rather than becoming a signal without price confirmation, the golden cross could strengthen an already-improving structure if ETH is able to establish itself above $1,950.


Be the first to comment