



Hedera has just released a five-week artificial intelligence (AI) agent bounty, where developers on HBAR Network can snatch prizes from $500 to $1,500.
Kicking it off with the Fun Basic Hedera Agent task, crypto enthusiasts are asked to build a simple, delightful AI agent on top of the Hedera Agent Kit.
Sponsored
Crypto Prediction Markets

18+ · Gambling involves risk. Play responsibly.
This could be used for commercial interactions too, enabling the participants to instantly monetize their work regardless of winning or not.
Web3 builders can start from the official Hedera-given examples or utilize the Agent Lab on HBAR Network to materialize their ideas. The only requirement – your agent must perform a real transaction (payment, purchase or on-chain action.
HBAR Now Edges Ethereum & Chainlink In Dev Action
The initiative comes with a perfect setting in terms of blockchain network development – HBAR Network’s activity has soared to 177.73, according to Santiment Intelligence. The blockchain data platform puts HBAR Network at the second place by most rapidly-growing dev activity, edging way bigger names like Ethereum (ETH) & Chainlink (LINK).
However, this has yet to reflect on Hedera’s native token price – HBAR stays below the crucial resistance line of $0.09. Picking up 1% gains in 24 hours, HBAR’s price still lags behind Bitcoin (BTC) in terms of correlation as the apex digital asset hits $77.7K. This could be explained by the vague speculative interest in HBAR, as well as the stagnant volumes on Spot markets.
HBAR Price Stalls As Volume Lags Behind Competition
The #29 crypto by global market capitalization managed to register just $36.52 million in volume on Monday, according to CoinGecko. Rocking a $3.88 billion market cap, HBAR is exposed to a considerably smaller daily trading volume than Litecoin (LTC) or Shiba Inu (SHIB), two altcoins with similar figures in terms of market cap.
On the brighter note, the technical implications offer a slightly different perspective. Digging deeper into the on-chain metrics, DailyCoin’s research team found HBAR to be heavily in the red in terms of crypto whale sentiment on the longer time-frames, but the one-hour candle sticks hint at large investors believing the $0.089 support being the local bottom.
This also resembles a multi-year falling wedge, situated around $0.088 – $0.089, which implies a plausible 100 – 200% northbound ascension towards 2025 price highs if the risk-on appetite returns.
For now, the implications are mixed sentiment-wise. Some Crypto Fear & Greed indicators pointed to ‘neutral mode’, while others had still not moved from last week’s fear.
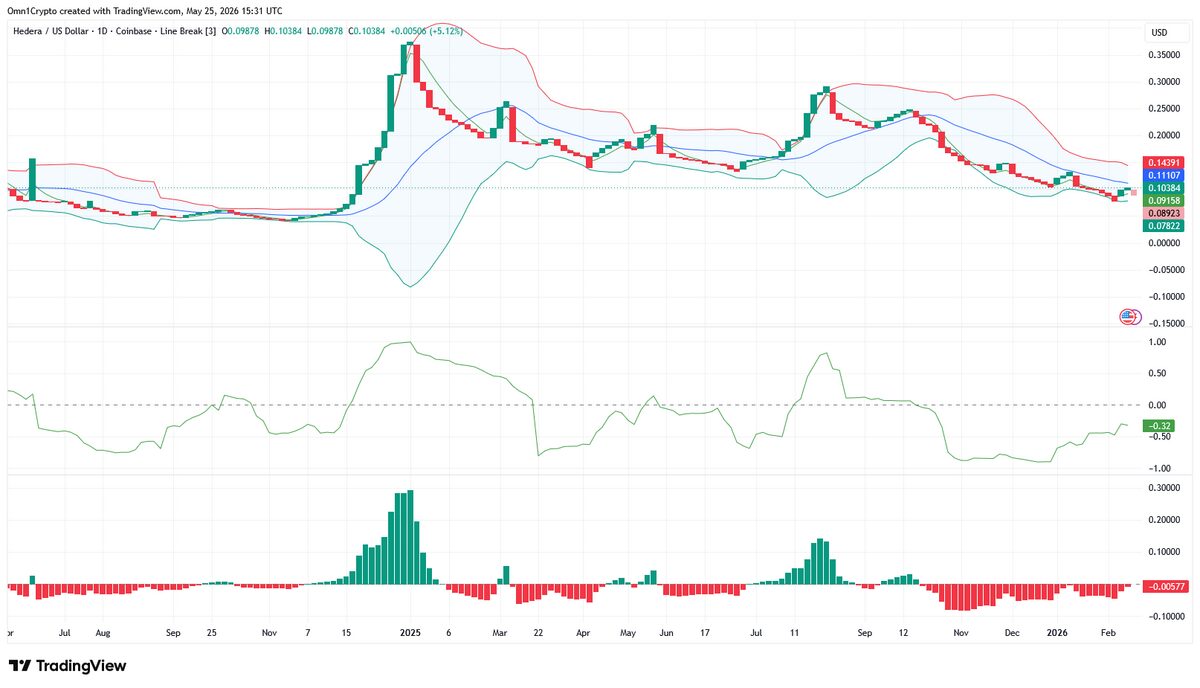
If the aforementioned HBAR price area holds, target $0.143 target remains in-tact, while a downwards break would put the altcoin on complete reliance on the lower-tier Bollinger Band (BOLL), situated at $0.078. With on-chain signals still mostly bearish on the daily time-frame, rising developer activity doesn’t necessarily imply an imminent liquidity boost.
Delve into DailyCoin’s hottest crypto scoops today:
Bitmine Russell 1000 Inclusion Could Boost ETH Treasury Exposure
Binance XRP Liquidity Hits 2020 Lows Ahead Of 24/7 CME
People Also Ask:
HBAR has been stuck in a long downtrend for several years. Right now, the price is testing that trend line. If it breaks cleanly above it, many traders believe it could kick off a strong rally — potentially 2-3 times higher from current levels. These kinds of long-term breakouts often lead to some of the biggest moves in crypto.
According to Santiment’s latest data, HBAR just ranked #2 overall in notable development activity over the past 30 days. That puts it right behind one project and ahead of big names like Chainlink, Ethereum, and Sui. High developer activity is usually a positive sign that real building is happening behind the scenes.
That’s the key level bulls are focused on. With the potential downtrend break plus this strong #2 developer ranking hitting at the same time, many see $0.14 as the next major resistance that could get taken out, opening the door to higher prices.
It’s backed by two independent data points. One is a clear technical chart pattern showing the multi-year downtrend. The other is Santiment’s verified GitHub and development metrics. When technicals and on-chain developer activity line up like this, it often gets attention from traders and investors.
DailyCoin’s Vibe Check: Which way are you leaning towards after reading this article?





Be the first to comment