



What to know:
- JasmyCoin faces bearish pressure after losing all major moving averages, confirming a short-term downtrend.
- Sharp reversal from the mid-May breakout above $0.00760 shows failed bullish momentum and stronger seller dominance.
- JASMY structure has shifted from consolidation to bearish control, with $0.0054 as a key support zone.

JasmyCoin (JASMY) surged after consolidation but reversed sharply, falling below key moving averages, the JASMY price entered into a bearish structure, while weakening RSI, declining open interest, and lower trading volume all indicate fading momentum and cautious, reduced trader participation.
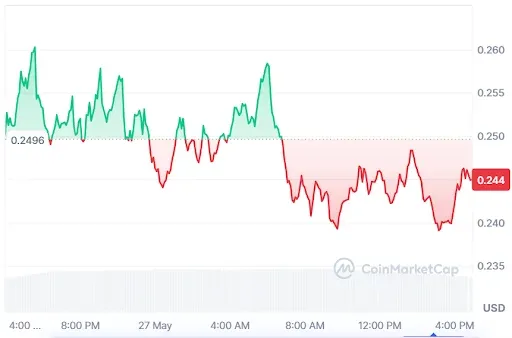
At the time of writing, JASMY is trading at $0.005466 with a 24-hour trading volume of $19.75 million and a market capitalization of $270.3 million. Despite the signs of stability over the last 24 hours, experts point to the bullish reversal for the JASMY price as the bullish structure remains intact.

Source: CoinMarketCap

JASMY Price Approaches Make-or-Break Price Level
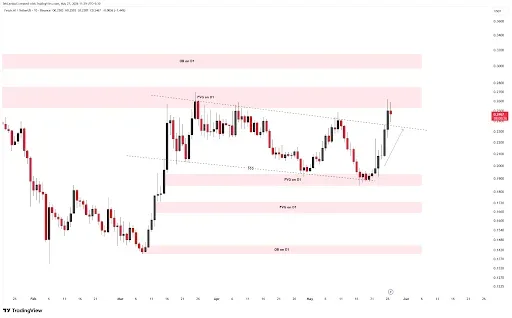
Furthermore, the crypto analyst Team LAMBO pointed out that the JASMY price is testing a crucial Fair Value Gap (FVG) support zone, which analysts describe as a potential last line of defense for the current price structure.
A successful rebound from this area could stabilize momentum and encourage buyers to re-enter the market, while failure to hold support may trigger stronger bearish pressure and deeper downside movement.

Source: Team LAMBO’s X Post
The market sentiment is predicted to remain cautiously optimistic until the JASMY price breaks out of the downward-sloping resistance line at approximately $0.0057.
While analysts believe that breaking out of this resistance line would suggest positive momentum, traders will watch for any reaction thereafter. The key will be the extent to which there is a solid volume of buying activity.
Also Read: JASMY Price Prediction: Fractal Setup Hints at a Rally Toward $0.055
JASMY Faces Pressure Below Key Moving Averages
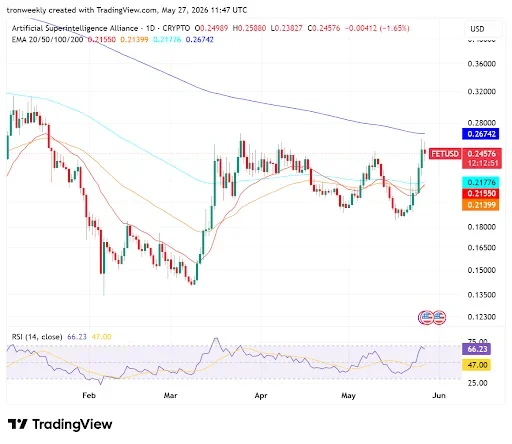
According to TradingView, the JASMY price shows a prolonged consolidation pattern from March to April before a strong, parabolic breakout is seen in mid-May.
The JASMY price surge was able to surpass the 200-day EMA, hitting a high beyond the 0.00760 mark. But due to heavy selling action, there was an immediate reversal, causing a steep retracement to 0.00542.

Source: TradingView
Technically, the JASMY price is bearish, as it is currently moving below its 20-day, 50-day, 100-day, and 200-day moving average lines. The breakdown confirms that there is strong negative momentum in the short term for the JASMY price.
Furthermore, the Relative Strength Indicator has fallen from overbought territory to 40.49, signifying a sharp decline in bullishness while selling prevails.
JASMY Derivative Data Point to Cautious Outlook
However, the open interest in JASMY decreased by 2.62% to $16.17 million. The fact that interest decreased shows that investors are liquidating their positions rather than entering into them, which signifies a negative mood in the market.


Source: Coinglass
Trading volume has fallen to $21.73 million, a drop of 38.46%. The fall represents lower trading activities in the market due to decreased involvement by traders as they become more cautious while entering into new positions.
This article contains market analysis and price predictions. These are not guarantees. Crypto markets are volatile. Always DYOR. Not financial advice.
Also Read: JASMY Price Breakout Above Weekly High Could Trigger Strong Rally to $0.27


Be the first to comment