



What to know:
- XPL price moved lower as Plasma faced renewed selling pressure near key support levels.
- Analyst Crypto With Gopal sees a Double Bottom forming after the prior breakdown played out.
- EMA and Bollinger Band data show XPL testing support below the $0.11306 resistance.

XPL price moved lower on Tuesday, 7 July, 2026, as Plasma faced renewed selling pressure, while traders watched whether buyers could defend the latest support area. The market setup remained focused on a possible recovery attempt after recent volatility.
As of press time, Plasma (XPL) price fell to $0.1026 after a 5% decline in the past 24 hours, while short-term trading activity weakened. CoinMarketCap data shows trading volume at $101.72 million, down 20.62%, although the token remained up 14.31% over the last seven days.
Also Read: Litecoin Price Prediction Turns Bullish: Can LTC Hit $50 Next?

XPL Price Forms Double Bottom Setup
A prominent analyst, Crypto With Gopal, highlighted that XPL is forming a Double Bottom after an earlier Double Top breakdown had already played out.
He pointed out that buyers were coming back around the short-term support area and attempting to regain momentum following the recent pullback. The setup kept traders alert to the possibility of demand to stay above the new base.
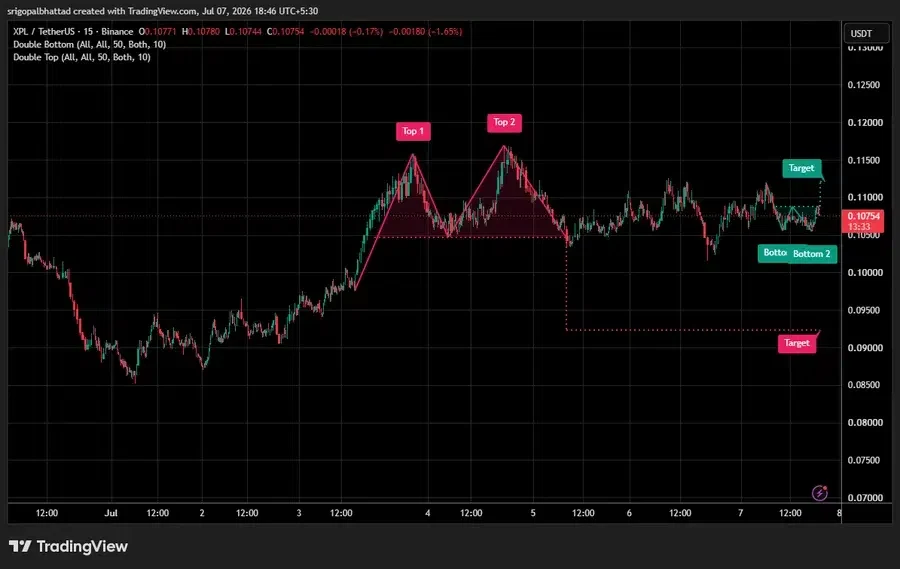

A breakout above the recent resistance area would help to confirm a bullish reversal, the analyst said. However, a loss of the new support area would give sellers fresh control. He noted that to validate any breakout attempt, stronger volume is required.
XPL Futures Volume and Open Interest Fall
According to CoinGlass data, the future trading volume fell 21.66% to $145.69 million. The open interest has also gone down by 4.91% to $153.96 million. The XPL OI-weighted funding rate was at 0.0056%, with limited positive positioning.
Liquidation data showed pressure on leveraged traders. Total liquidations in the past 24 hours amounted to $229.99K.
Long liquidations accounted for $145.06K, while short liquidations totaled $84.92K. The higher long liquidation figure indicated that buyers were under greater pressure in the latest move.
Why XPL Price Must Hold EMA Support
According to TradingView data, the XPL price is trading near the short-term moving average cluster. The 20-day EMA stands at $0.09841, while the 50-day EMA is at $0.09469. Both levels fall below the current price, indicating that buyers are still holding onto the near-term trend.
The 100-day EMA is currently at $0.10282, which is almost in line with the market price. The 200-day EMA is much higher at $0.15721, showing that the broader trend remained below longer-term recovery levels. A breakout over the 100-day EMA would favor the short-term structure.
The Bollinger Bands (BB) show that the middle band is at $0.09823, the upper band is at $0.11306, and the lower band is at $0.08340.
The XPL price is ranging in the middle band and did not break the upper resistance area. The bullish reversal setup would be bolstered by a close higher than $0.11306, but the bearish scenario could be supported if the price breaks below $0.09823.
This article contains market analysis and price predictions. These are not guarantees. Crypto markets are volatile. Always DYOR. Not financial advice.
Also Read: Cardano Price Rises Toward $0.20 After Positive Wallet Growth News


Be the first to comment