



Market data suggests that XRP could rise toward the $30 price area if its long-term ascending channel continues to hold.
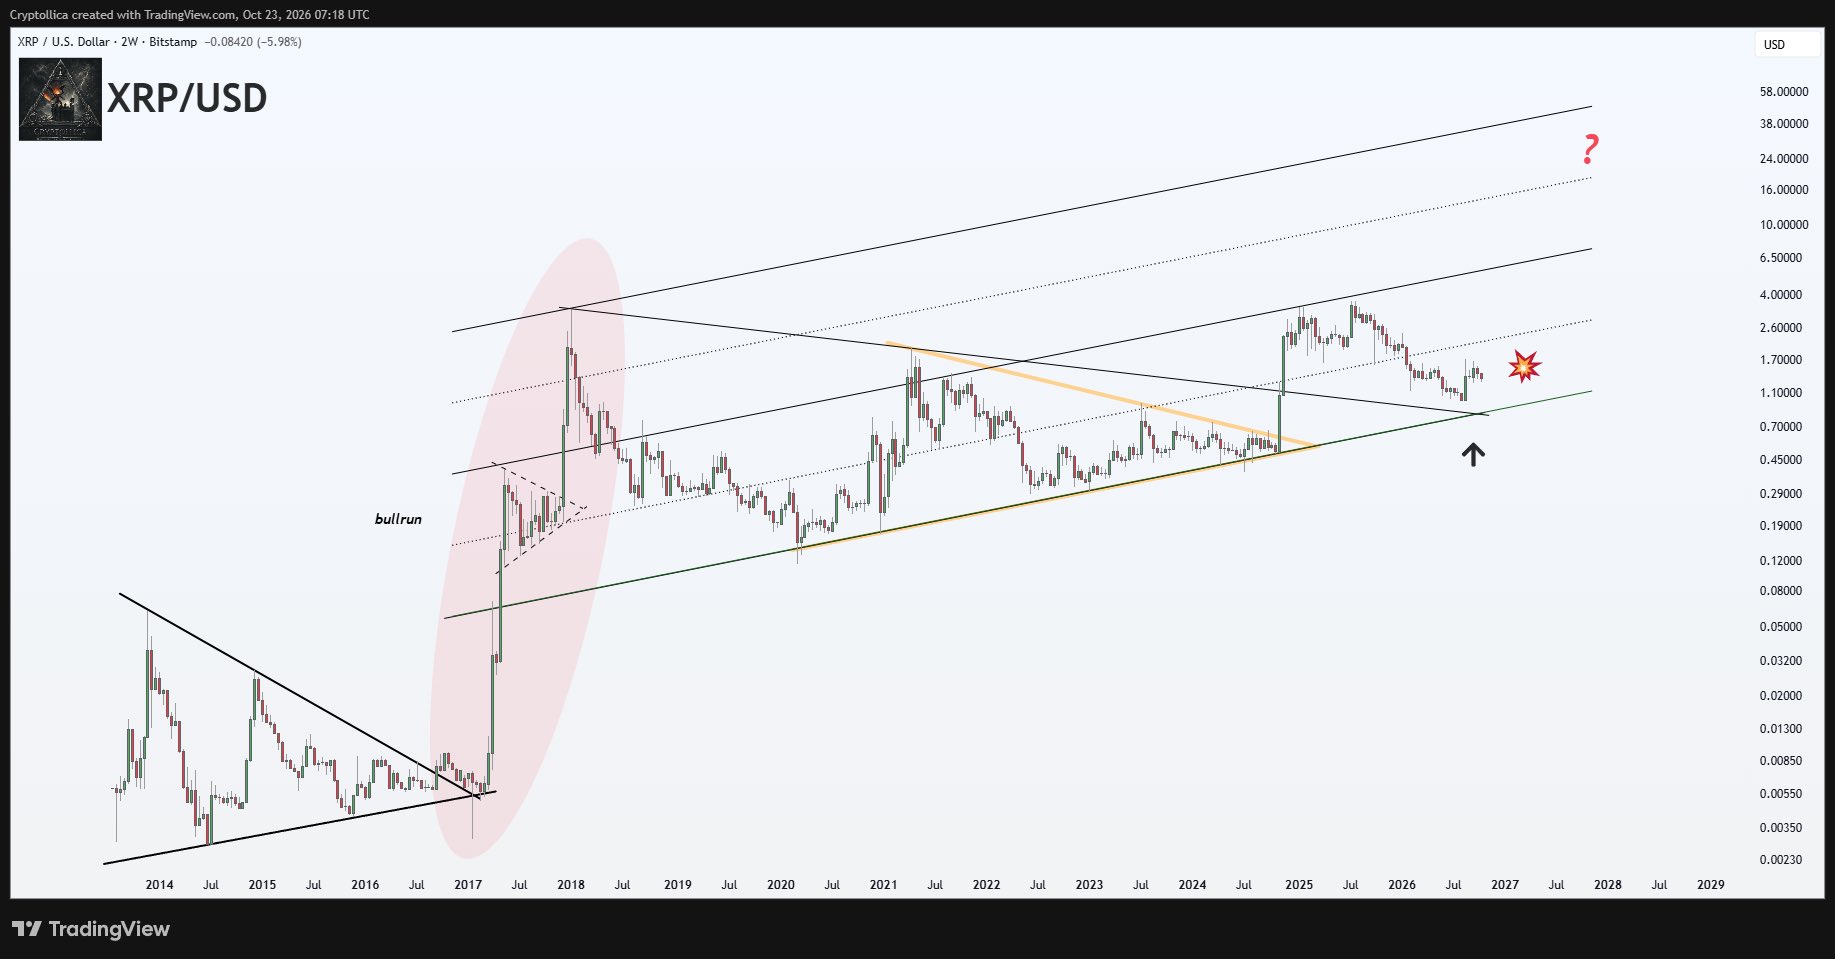
The two-week chart shows that the XRP has followed this pattern since 2017. XRP now trades near $1.30, down about 64% from its July 2025 all-time high of $3.66, and is approaching an important support zone.
The XRP Ascending Channel consists of two upward-sloping trendlines that have guided the asset’s price movements over several market cycles. Extending the upper trendline into 2028 leads to a potential price range of $24 to $38. However, the target remains an uncertain projection.
XRP Ascending Channel Remains Intact
The chart shows how the XRP Ascending Channel started forming following the 2017 bull run. Since then, XRP has experienced several rallies and corrections while remaining within the channel’s broader boundaries.

On the logarithmic chart, the channel’s lower boundary currently sits around $0.70 to $1.10, while its upper boundary falls between $4 and $6.50. The upper trendline has continued to rise, pushing its projected value higher as the channel extends into future years.
A dotted trendline running through the middle of the channel shows another important price reference. This line crosses the $1.70 to $2.60 region, which could act as resistance during a recovery. XRP would need to regain this area to strengthen its chances of moving toward higher price levels.
XRP’s 2017 Rally
The current structure looks like XRP’s price action before its historic rally in 2017. Between 2013 and early 2017, XRP traded within a narrowing range as its price formed lower highs against a relatively flat support level.
The cryptocurrency eventually broke out of this pattern and began one of the largest rallies in its history. XRP climbed from around $0.006 in January 2017 to $3.3 in January 2018, a more than 55,000% rally.
This upsurge also helped establish the price structure that analysts now use to draw the long-term ascending channel.
The current structure shares some similarities with that earlier period. XRP has experienced a major rally and has since returned to an important support area. However, this does not mean the cryptocurrency will repeat its previous performance.
Smaller Symmetrical Triangle Pattern
The chart also reveals a smaller formation within the XRP Ascending Channel. The orange trendlines form a symmetrical triangle pattern that developed between 2021 and 2024 as XRP moved through several years of consolidation.
XRP broke above this formation in late 2024, leading to its subsequent rally to a new all-time high of $3.66 in July 2025. This confirmed the bullish interpretation of the broader channel, although the price decline that followed has put the structure under renewed scrutiny.
At press time, XRP has fallen roughly 64% from its peak to around $1.30. The decline has brought the cryptocurrency back toward the lower part of the long-term channel.
This makes the current support zone important to its next move. A successful defense of this area could support a recovery, while further losses may weaken the bullish outlook.
Can XRP Reach $30?
XRP’s response to current support could determine whether the long-term pattern remains valid. A recovery above the channel’s midpoint would improve market sentiment and give the cryptocurrency a chance to test higher resistance levels.
However, a decisive two-week close below $0.70 would weaken the XRP Ascending Channel structure. Such a move would signal a break below the structure’s lower boundary and undermine the argument for a rally toward $30 or higher.
The channel’s projected upper boundary falls between $24 and $38 in 2027 and 2028. From the current price of $1.30, XRP would need to gain approximately 2,206% to reach $30. Such an increase would require sustained buying interest and support from the broader market.


Be the first to comment