



XRP bears are currently facing resistance on the back of the recent rebound, but chart data suggests the downtrend may not be over.
XRP started the week under strong selling pressure after the U.S. Senate failed to advance the CLARITY Act, a bill that could have provided more regulatory clarity for digital assets.
The setback removed an important bullish factor for XRP and sent the token down to the $1.29-$1.30 range as sellers moved in. Since the SEC case, XRP has had links to U.S. regulatory developments, which made the Senate setback particularly important for the token.
XRP Records Bearish BoS
On the 4-hour chart, XRP recorded a bearish Break of Structure (BoS) after falling below the $1.3325 swing low and closing at $1.2951.

The move took XRP below the broken support and the lower volatility band at $1.3023. At the same time, the EMA21 stood at $1.3585, while the EMA55 remained at $1.3726. Both moving averages stayed above the price, which created a strong resistance area.
The previous major swing high at $1.4961 had also remained untouched for eight bars, and this added to the signs of weak buying pressure.
XRP had already moved beyond its 1.5x ATR (Average True Range) envelope, showing that the decline had moved quickly and covered a large range in a short period. Such a sharp move can leave room for a temporary recovery before the next major price move.
The structure suggests XRP could see a possible recovery toward the $1.3325-$1.3585 area. In this scenario, the former support at $1.3325 could turn into resistance, while the EMA21 at $1.3585 could limit the recovery.
A rejection from that area would strengthen the case for another decline toward $1.2450, followed by the psychological $1.20 level and potentially $1.10 if selling pressure increased.
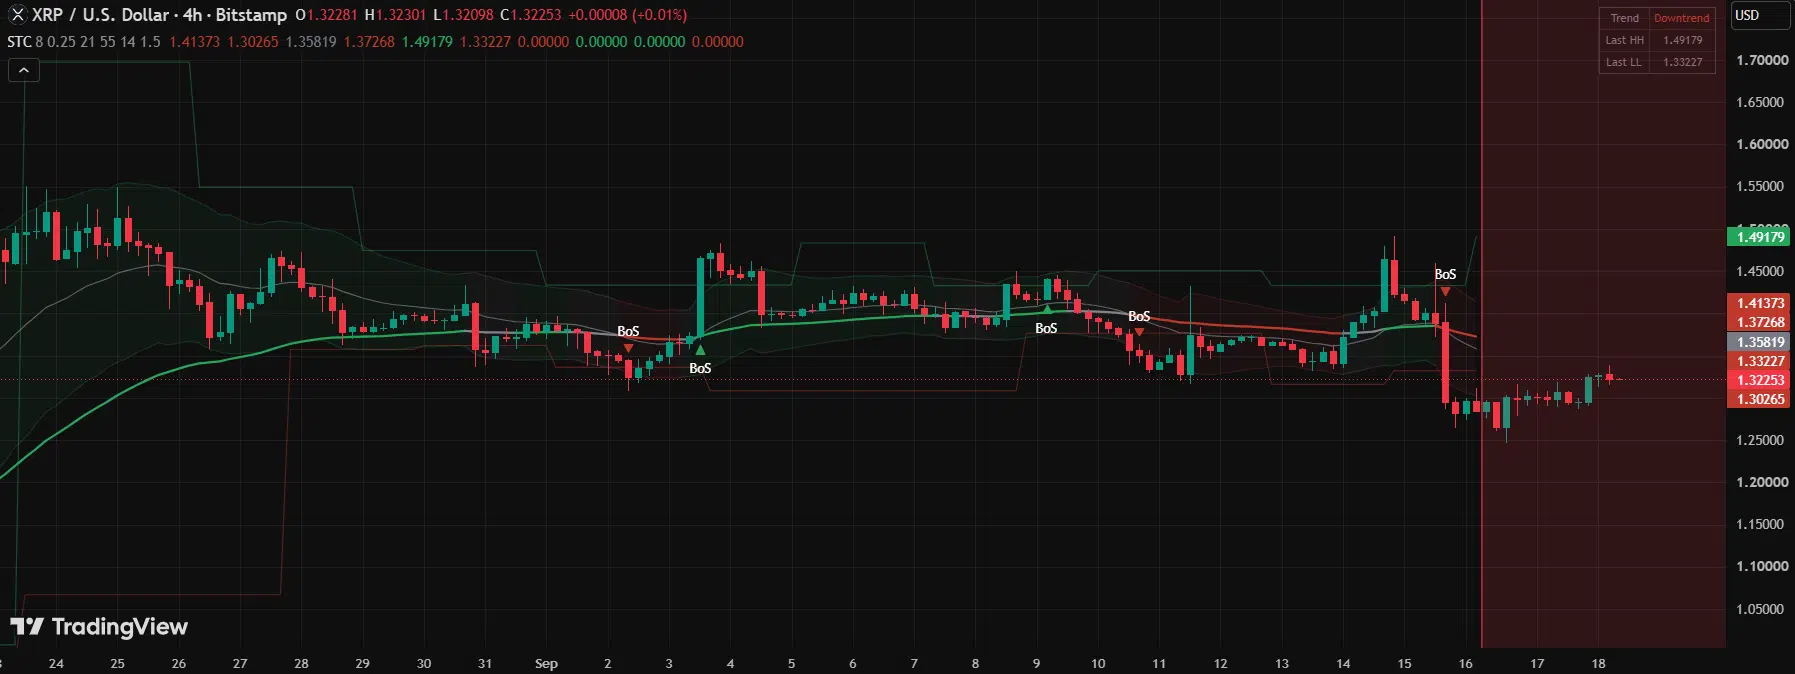
The key level that could invalidate the bearish setup remains the EMA55 at $1.3726. A 4-hour close above that level would weaken the bearish case and remove the basis for the lower targets.
Notably, the selling pressure also appeared in longer-term momentum, as XRP’s two-week RSI fell to around 33.5, the lowest reading shown across 13 years of XRP trading history.
Where XRP Stands Today
Interestingly, buyers have since returned, leading to a mild XRP recovery. The token now trades around $1.33, up 2.4% over the past 24 hours, with trading volume above $2.48 billion. The broader recovery across the cryptocurrency market has also helped support XRP.
Bitcoin and Ethereum have also joined the recovery, trading above $78,000 and $2,500, at press time. This broader improvement has given XRP some support after the decline earlier in the week.
The daily chart now shows a more balanced market. XRP at $1.33 sits between the daily EMA20 at $1.34 and the EMA50 at $1.29, while the price remains almost exactly at the EMA200 of $1.33. The daily RSI at 49.56 sits near the middle of its range.
The Key Question Now
Shorter timeframes now show stronger buying pressure. The 1-hour RSI stands at 65.02, while the 15-minute RSI is at 66.85. Both readings suggest that buyers have gained some strength in the short term.
The main area to watch remains $1.32-$1.34, which matches the zone identified in the earlier bearish setup. A break above this range could open the way toward $1.37 and then $1.46. Still, XRP needs to move through the wider resistance structure before the recent recovery can fully challenge the bearish setup.
Despite the ongoing rebound push, the original bearish structure remains relevant. XRP now trades closer to the $1.3726 EMA55 level that would invalidate the bearish setup.
A 4-hour close above $1.3726 would invalidate the structure and bring the $1.4961 swing high back into focus. On the other hand, a rejection from the current $1.33-$1.37 area would keep the downside levels at $1.2450, $1.20, and $1.10 relevant.


Be the first to comment