



XRP could fall another 15.8% from its current price to retest a major level from its recent breakout above a descending channel.
The weekly chart places this level around $1.1449, where the former resistance line could now provide support. If buyers defend the area, XRP could recover above $2. However, a break below it could expose the cryptocurrency to further declines below $1.
XRP Forms Descending Channel
The descending channel began to form after XRP fell from its $3.66 all-time high in July 2025. For several months, the pattern limited the asset’s recovery, as rallies repeatedly failed at the upper trendline. Each failed attempt also produced a lower high, keeping the price under pressure.
For instance, XRP attempted a breakout on Oct. 6, 2025, when it reached $3.05, but resistance at the upper trendline forced another pullback. In addition, on Jan. 5, 2026, the price climbed to $2.41 before another decline followed.

During this period, the channel’s lower trendline continued to support XRP whenever sellers attempted to push the price lower. The last major test came in June 2026, when XRP fell to $1.0080.
XRP Bears Eye $1.14 After Channel Breakout
After months of declines and recoveries, XRP broke above the channel’s upper trendline in August 2026, recording a 53% weekly gain. The breakout marked a change in the chart structure and raised the possibility of a longer recovery.
XRP subsequently climbed to $1.70 in August before pulling back to $1.25 by September 2026. This decline brought the price back to the former upper trendline, which aligned with the September low.
XRP then recovered to $1.65 later in September, but the latest correction has now put the breakout structure under pressure again.
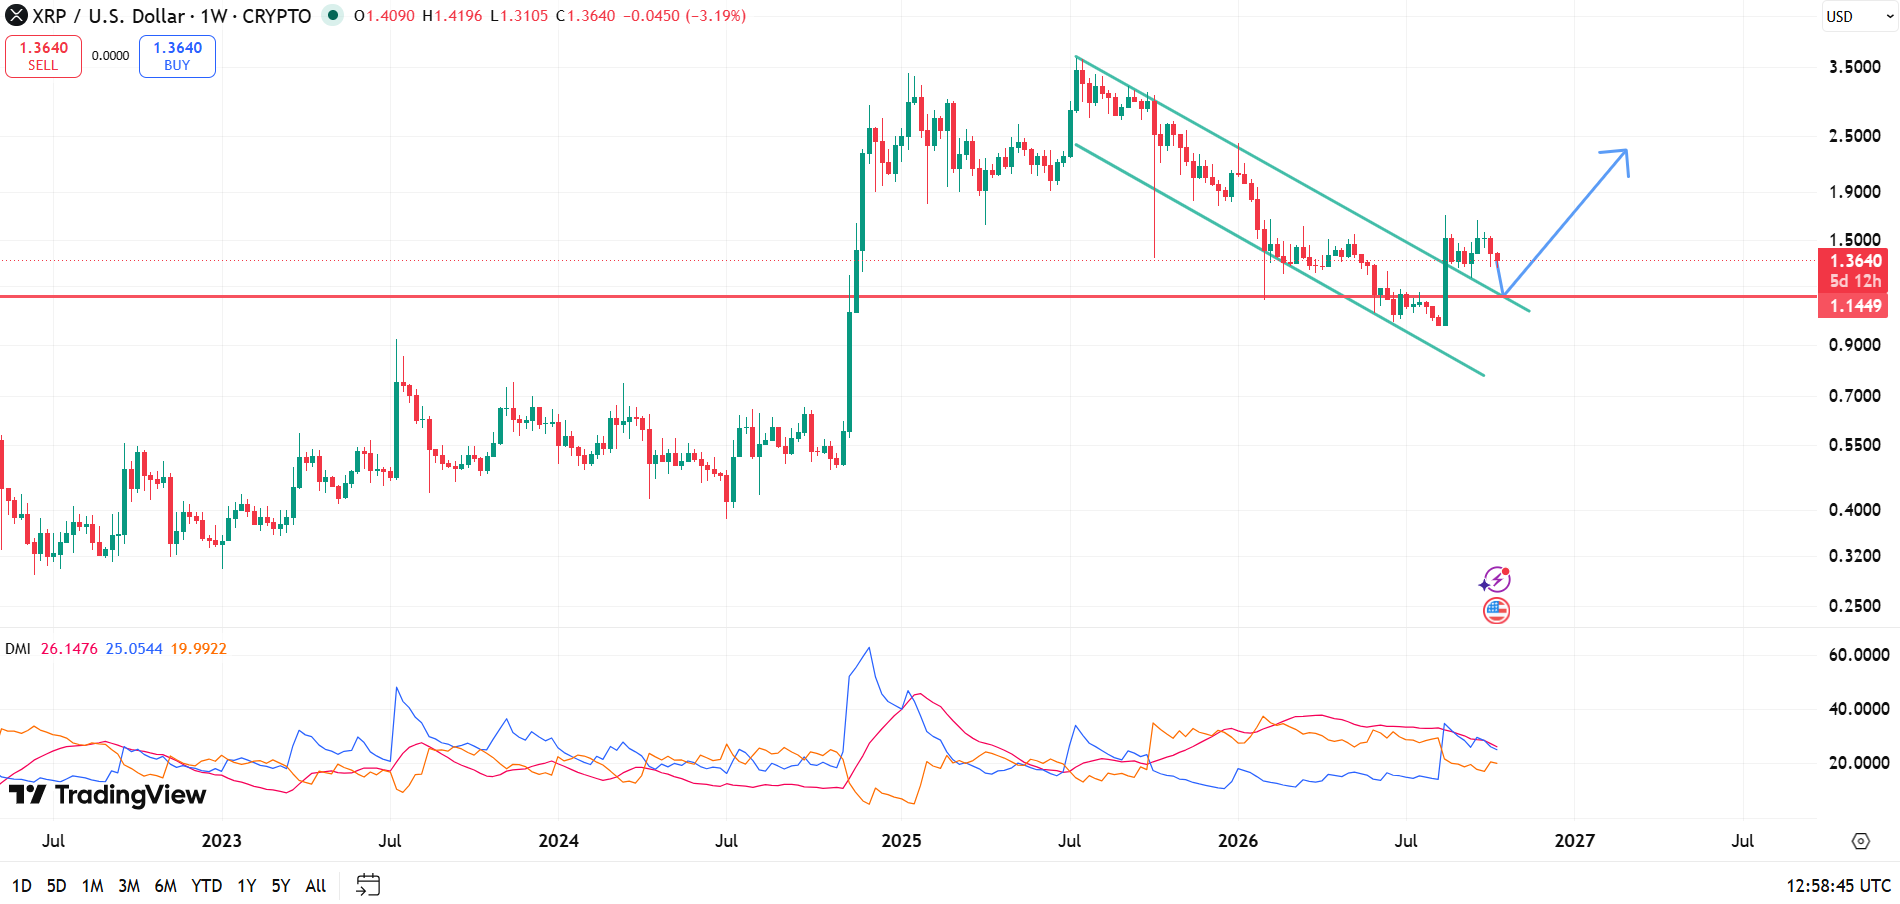
If the decline continues, the former channel resistance could provide support around $1.1449. With XRP trading at $1.36, a return to this level would amount to a 15.8% decline. Holding this area would help preserve the bullish outlook following the August breakout.
If buyers defend the $1.14 area, XRP could recover beyond $2 and potentially reach $2.33. Such a move would depend on the price finding support around the former channel boundary and attracting enough buying interest to resume its upward movement.
However, the structure carries downside risks. If buyers fail to defend the breakout level, possibly because of a wider cryptocurrency market crash, XRP could fall below $1. In this case, the price could revisit its August 2026 lows near $0.98.
XRP DMI Shows Buyers Losing Momentum
The Directional Movement Index (DMI) further confirms XRP’s current position. The positive directional indicator (+DI) stands at 25.0544 but is trending downward. This suggests that the medium-term uptrend remains intact, although buying momentum is weakening.
The Average Directional Index (ADX) stands at 26.14, indicating that the trend still has strength. However, its downward movement suggests that the trend is losing momentum. Meanwhile, the negative directional indicator (-DI) stands at 19.99 and continues to rise gradually, pointing to increasing bearish pressure.
These indicators suggest that XRP’s recovery trend has not fully broken down, but buyers face growing pressure. The price’s response around the $1.14 channel breakout level could help determine whether XRP resumes its recovery toward $2.33 or falls toward the $0.98 support area.



Be the first to comment