




XRP traded relatively weakly on Monday, closing around $1.50 after falling roughly 1.27% during the session, according to CoinMarketCap data.
The decline came as XRP struggled to reclaim the $1.55 area, leaving the token below a level that could be important for any attempt to extend its recent recovery.

However, subdued price action hasn’t stopped analysts from identifying increasingly bullish technical setups for XRP. Veteran trader Peter Brandt is now watching a pattern that could send the token toward $2.16, while other analysts have outlined considerably more ambitious targets.
In a tweet, Brandt identified a cup-and-handle formation on XRP’s chart, suggesting the structure could eventually produce a measured move toward $2.16.
The trader also sees the cup-and-handle developing into the right shoulder of a larger inverse head-and-shoulders pattern. He explained that technical formations are not fixed and can change as price action develops.

 
“The measured move would be to 2.16, which is the height of the inverted H&S (closing price, daily) projected upwards.” He wrote.
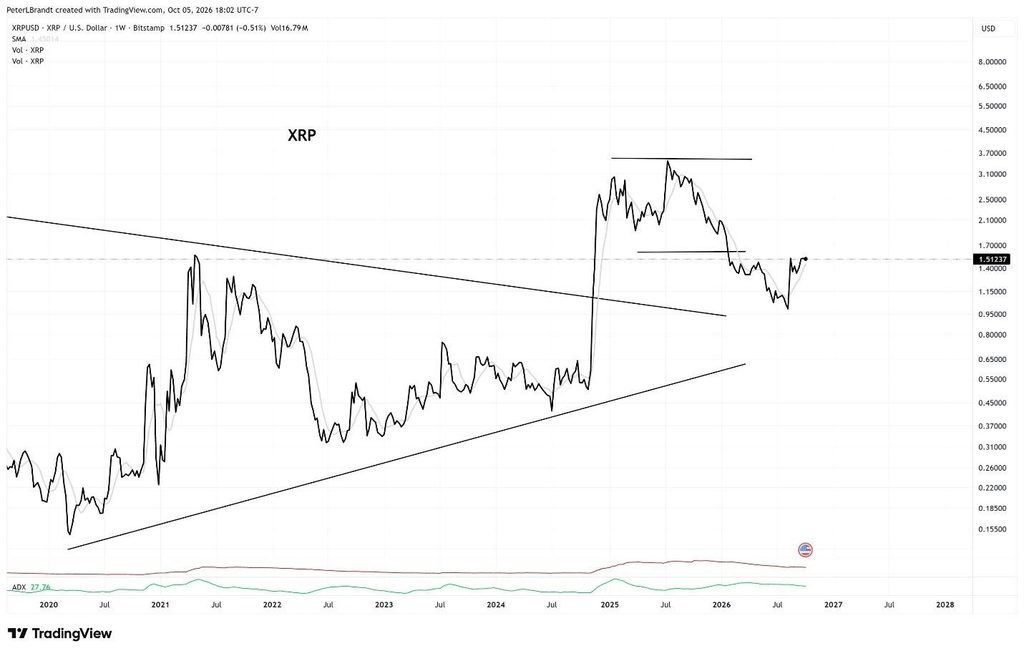
At XRP’s current price near $1.50, the target would represent roughly 44% upside.
However, Brandt warned that XRP has a major obstacle above its current price. The trader pointed to substantial overhead supply, meaning a large amount of XRP could potentially come onto the market as prices recover.
Elsewhere, macro strategist Gert van Lagen identified a symmetrical triangle on XRP’s monthly chart and projected a potential breakout toward $50.
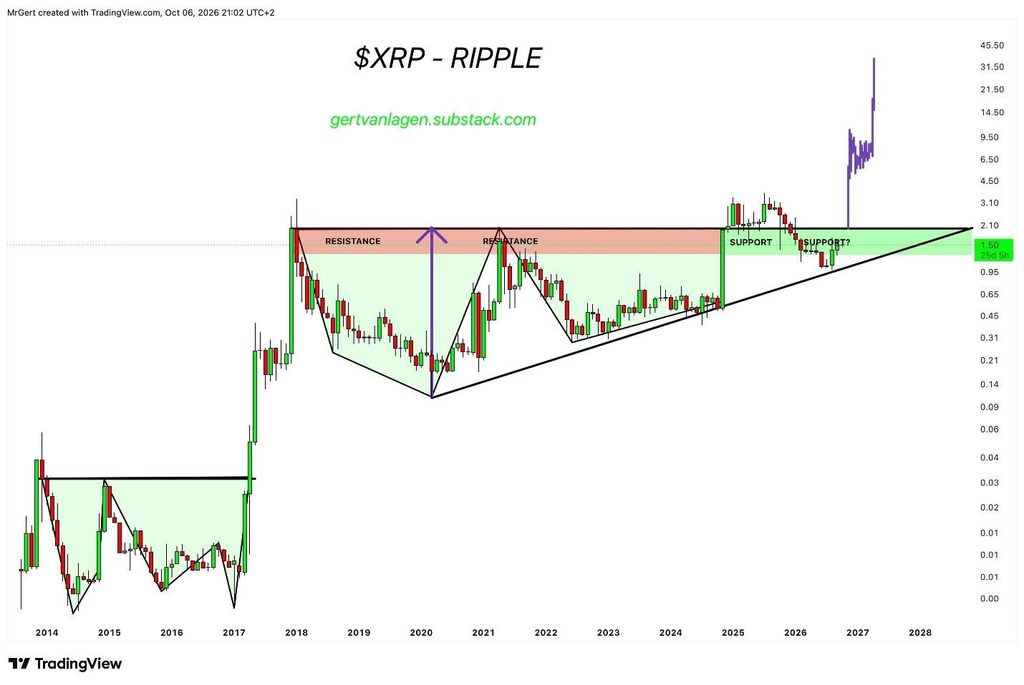
Notably, the analyst’s thesis draws on XRP’s explosive performance during previous market cycles. He pointed to the 2017 bull run, when XRP/BTC surged 50x in just two months, suggesting that a comparable move could potentially unfold again in the current cycle.
“XRP [1M] – Symmetrical triangle targeting ±$50 at a $3T market cap.” He stated. “This would be normal bull market dynamics for Ripple. In 2017, it took only 2 months for XRP/BTC to 50X from the current level to 0.00011, which would imply BTC at $450k and XRP at $50.”
Meanwhile, analyst Javon Marks has also maintained a bullish outlook. His analysis pointed to a breakout from a descending-triangle structure and a potential measured move above $15, which is an 896% increase
Interestingly, these bullish technical forecasts arrive as XRP sentiment has deteriorated.
Santiment reported in early October that XRP’s bullish-to-bearish commentary ratio had fallen to 0.67, its lowest level since August 17. A reading below 1 means bearish commentary had become the majority across platforms including X, Telegram, and Reddit.
Such pessimism can sometimes create a contrarian setup, particularly if selling pressure begins to exhaust itself. However, negative sentiment alone does not guarantee a reversal.




Be the first to comment