


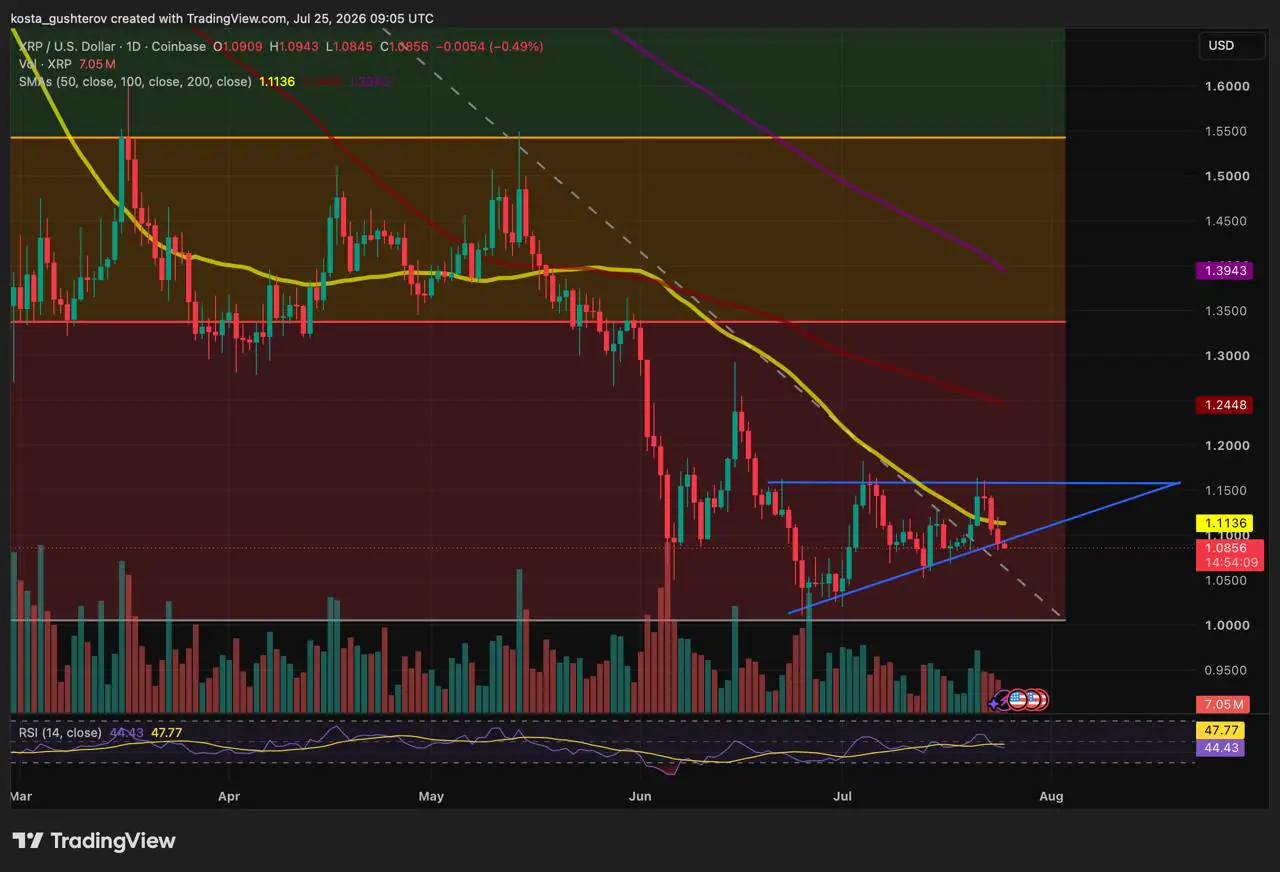
XRP trades at $1.08 after decisively trading below the rising support that had defined its consolidation since late June.
Key Takeaways
- XRP closed yesterday below the rising support of its recent consolidation pattern.
- Upbit’s XRP reserve fell to its lowest level since May; Binance remains 200M XRP below its March peak.
- Spot XRP ETFs recorded zero net flows for three straight days after inflows on July 20 and 21.
The break is not a marginal poke – price now sits roughly $0.10 under where that trendline currently projects – and it arrives with XRP already trading beneath its 50-day moving average near $1.1.
A Decisive Break, Not a Bounce
Consolidation patterns like this one represent a tug-of-war between buyers and sellers. Just days earlier, whale accumulation had XRP compressing toward the $1.16 breakout trigger, with the same rising support line and horizontal ceiling defining the range. That setup has now resolved – but to the downside. When price closes outside the lower boundary rather than bouncing toward the apex, it signals sellers overwhelming buyers at that level rather than a routine test of support.
As long as XRP respected the rising trendline, the chart maintained a sequence of higher lows. Slicing below it breaks that sequence and turns the former floor into a ceiling – a structural shift that flips short-term bias to the downside.
Exchange Reserves Diverge Across Venues
According to an analysis shared by CryptoQuant analyst Amr Taha, XRP reserves are moving in different directions depending on the venue: Upbit has slid to a multi-month low, Binance remains well below its March high, and Bithumb has returned close to its late-May level.
Reserve declines alone don’t determine whether XRP is being moved into self-custody, transferred between platforms, or redistributed elsewhere, but the divergence is a relevant input alongside the bearish price action.
| Exchange | Current Reserve | Change From Recent Peak |
|---|---|---|
| Upbit | ~6.43B XRP (lowest since May) | -85M XRP (-1.3%) from May 30 high of 6.515B |
| Binance | ~2.60B XRP | -200M XRP (-7.1%) from March 17 high of 2.80B |
| Bithumb | ~1.83B XRP | Near late-May level |
ETF Demand Goes Quiet
Institutional flows into spot XRP ETFs have paused with daily net inflows registered $0.00 for three consecutive sessions – July 22 through 24 – following a $5.66 million inflow on July 21 and $2.49 million on July 20.
The pause follows a stronger stretch earlier in the month, when ETFs logged their largest single-day inflow of July on July 16, per SoSoValue. A stall in demand at the same time the technical structure is breaking down removes one potential offset to the price action, though it doesn’t by itself confirm further downside.
What Could Change the Picture
Reclaiming the broken trendline, now overhead near $1.15–$1.17, would repair the structure and open a retest of the pattern’s flat ceiling, with the 50-day average the first hurdle along the way. Short of that reclaim, any bounce reads as relief inside an invalidated setup rather than a recovery.
Continued weakness exposes the $1 psychological zone, which also lines up with the pattern’s measured-move target. A close below it would mark the first sub-dollar print since the consolidation began.
Ascending triangles resolve upward more often than they resolve downward, which makes this clean break lower a meaningful tell. RSI near 44, sitting under its signal line, points to fading momentum rather than an oversold bounce setup, and price remains below all three major moving averages, keeping the broader trend firmly down.
- Disclaimer: This content is for informational purposes only and should not be treated as financial or investment advice. Markets are volatile, and past chart behavior doesn’t guarantee future results. Make your own decisions and consult a professional before trading.
- Methodology: Technical levels are sourced from the daily XRP/USD Coinbase chart via TradingView (July 25, 2026); exchange reserve figures come from CryptoQuant report, and ETF flow data is from SoSoValue.

Alex is Editor-in-Chief of Coindoo and co-founder of Millennial Media Group, with nearly a decade of experience covering financial markets – crypto first, then everything else.
It started in 2016 with Bitcoin. Like most people at the time, he didn’t fully understand it – so he kept digging. Blockchain, tokenomics, the projects, the cycles. That curiosity never stopped, and eventually pulled him into traditional markets too: equities, commodities, macro. Not because he left crypto behind, but because you can’t properly understand one without the other.
What drives him is straightforward: he wants to know why something is happening, not just that it’s happening. Most market coverage stops at the headline – price up, price down, here’s a chart. Alex finds that kind of reporting actively unhelpful. If you walk away from an article without understanding the mechanism behind the move, what did you actually learn?
He holds a degree in Tourism from New Bulgarian University – not the most obvious path into financial markets, but markets have a way of pulling in people who are simply too curious to stay out. He has authored over 200 in-depth analyses and more than 10,000 articles across crypto and traditional finance. He still thinks every day in markets teaches him something new. That’s probably why he hasn’t stopped.



Be the first to comment