


XRP is trading around $1.48 to $1.50 on October 4, with its latest recovery losing momentum beneath the $1.54 resistance level. Trading volume has also declined, showing that buyers have yet to generate enough demand to push the token beyond its September consolidation range.
The broader daily structure remains constructive following XRP’s rebound from approximately $1.00 in August. However, the four-hour chart continues to show lower highs, with immediate support near $1.45 and heavier resistance between $1.60 and $1.70.
US spot XRP exchange-traded funds (ETFs) attracted approximately $121.4 million in September, but the inflows have not translated into a sustained price breakout.
XRP needs to reclaim $1.54 and then overcome the $1.60 to $1.70 supply zone before $1.80 to $2.00 becomes a meaningful upside target.

XRP Consolidates Near $1.50 as Trading Volume Falls
XRP has spent much of the past month consolidating after its August recovery carried the token from roughly $1.00 to $1.70.
The latest October 3 trading snapshot placed XRP near $1.50, following several unsuccessful attempts to break through $1.54. Its reported 24-hour trading volume fell about 39.5% to $2.26 billion, reflecting reduced market participation as consolidation continues.
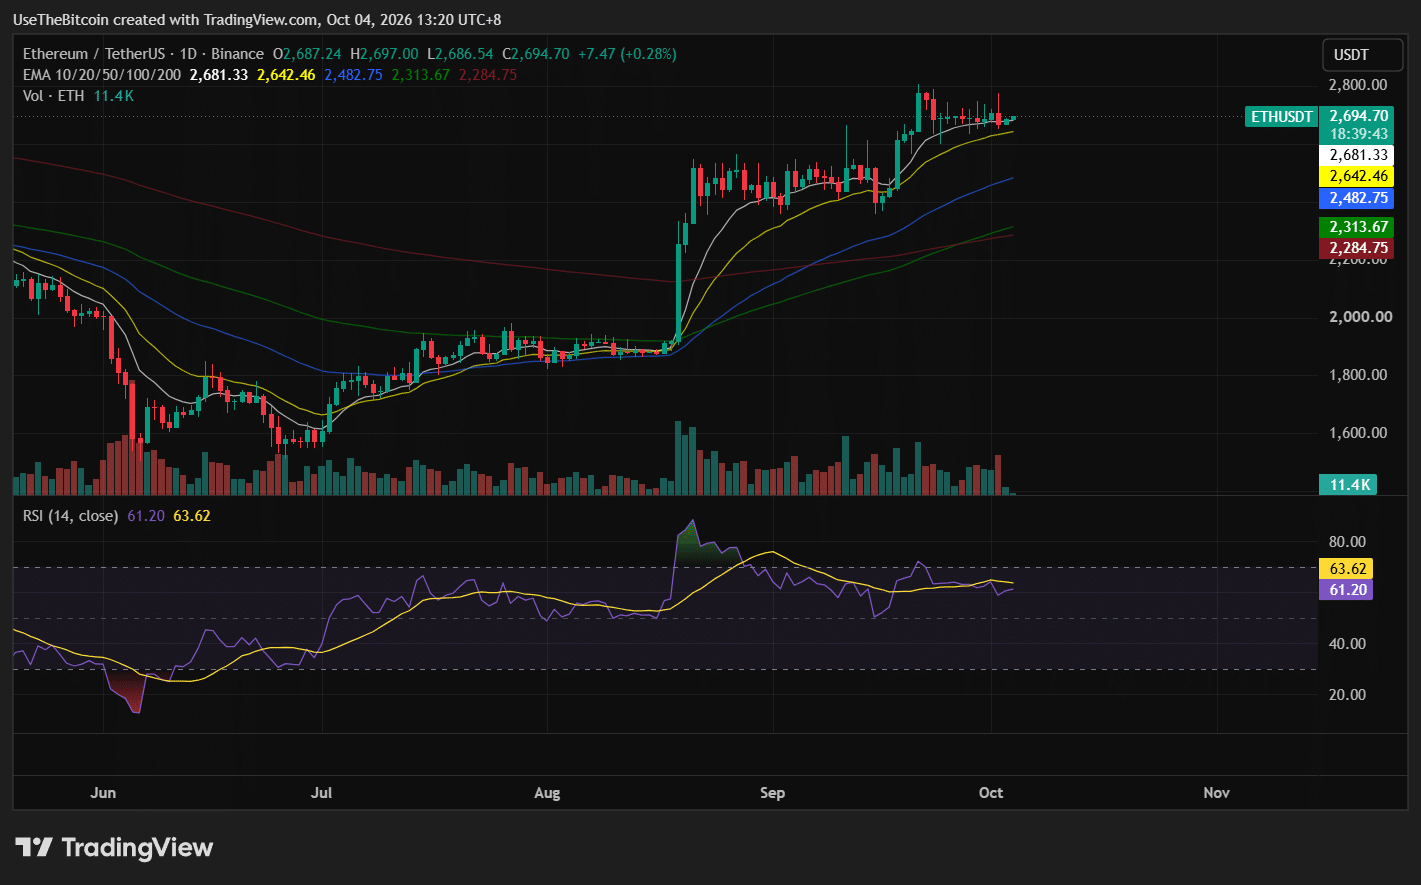
The immediate support sits around $1.48, followed by $1.45. A sustained decline below those levels could expose $1.40 and the broader $1.20 to $1.30 demand region.
On the upside, reclaiming $1.54 would improve the immediate setup, but a stronger recovery requires XRP to break through $1.60 to $1.70, where previous rallies encountered selling.
| XRP Level | Role |
| $1.54-$1.55 | Immediate resistance |
| $1.60-$1.70 | Major breakout zone |
| $1.80-$2.00 | Higher resistance and upside target |
| $2.40 | Longer-range resistance |
| $1.48-$1.50 | Immediate price pivot |
| $1.45-$1.46 | Short-term support |
| $1.37-$1.40 | Secondary support / 200-day EMA region |
| $1.20-$1.30 | Major daily demand zone |
Table 1. XRP Key Support and Resistance Levels
Daily Trend Improves, but the Four-Hour Chart Remains Cautious
XRP’s daily and four-hour charts currently show different levels of strength.
On the daily timeframe, XRP has recovered above its 100-day and 200-day moving averages. Both indicators have started flattening and turning upward around $1.30, reflecting an improvement from the prolonged weakness observed during the first half of 2026.
The 200-day exponential moving average (EMA) was also recently identified near $1.37, providing another technical reference below the current price.
However, the four-hour chart continues to form lower highs beneath a descending resistance line following September’s rejection around $1.60 to $1.70.
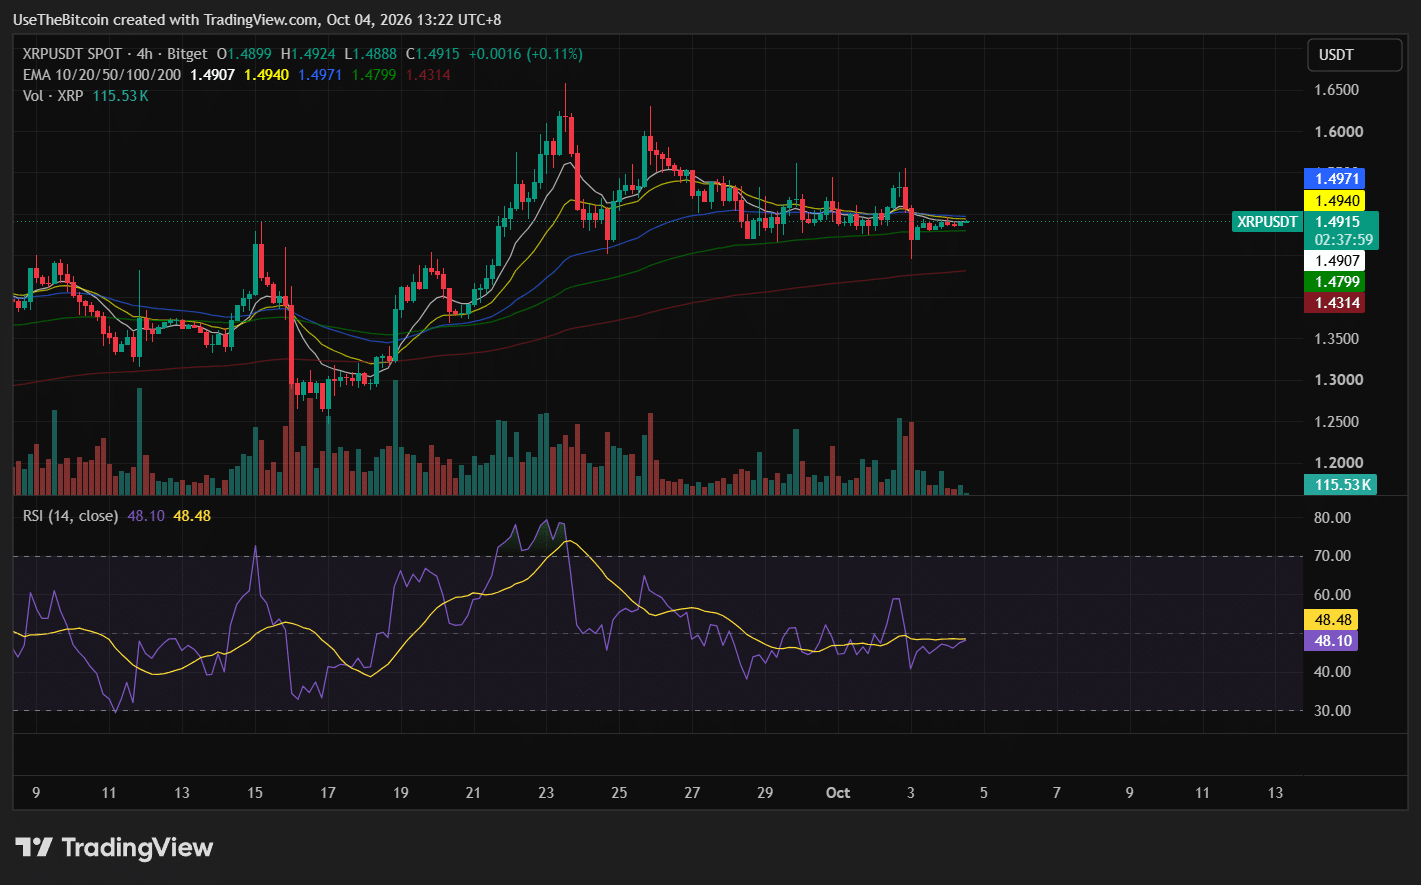
A break above that descending resistance, followed by a recovery through $1.54, would be the first indication that short-term sellers are losing control.
Meanwhile, the daily Relative Strength Index (RSI) has cooled toward neutral territory, with one October 3 reading near 55, leaving room for renewed upward momentum without XRP being as stretched as it was during August’s rally.
XRP ETFs Attract $121.4 Million Despite Weak Price Action
Institutional demand remained positive during September, even as XRP struggled to maintain its earlier gains.
US spot XRP ETFs attracted approximately $121.4 million in net inflows during the month. However, their combined net assets declined to roughly $1.69 billion by September 29 as XRP fell from approximately $1.66 toward $1.49.
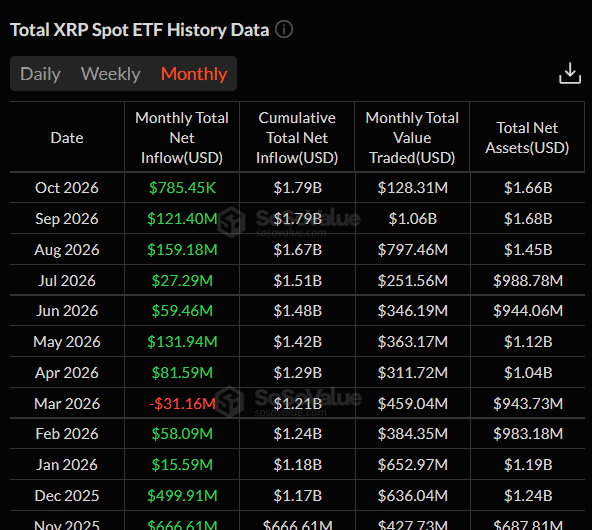
New capital can continue entering the products while falling XRP prices reduce the market value of existing holdings. Consequently, positive inflows do not necessarily guarantee an immediate price recovery.
The latest September inflows suggest continuing demand, but XRP still needs stronger spot buying to overcome the selling around $1.54 and $1.60.
$1.45-$1.46 Becomes the Key Downside Test
XRP’s latest rejection around $1.52 to $1.55 has brought attention back to the $1.45 to $1.46 support zone.
$1.46 is an important level for maintaining the short-term recovery. XRP would also need to reclaim its 50-week EMA to improve the broader weekly setup following its previous failed breakout attempt.
A decisive loss of $1.45 could accelerate selling toward $1.37, where the 200-day EMA provides another potential support reference.
Below that, the $1.20 to $1.30 region remains the more important daily demand zone.
Holding $1.45, meanwhile, would keep the current consolidation intact and leave room for another test of $1.54. Buyers would still need to overcome $1.60 to $1.70 before the larger recovery could resume.
CLARITY Act Setback Continues to Weigh on Sentiment
XRP has also faced regulatory uncertainty following the US Senate’s failed September procedural vote on the CLARITY Act.
The setback interrupted expectations for a clearer federal crypto market structure framework, with reporting linking the development to a sharp decline in XRP during September.
The latest October 3 market commentary also identifies weakening regulatory sentiment as one factor contributing to the token’s inability to move beyond $1.50 despite positive ETF inflows.
The failed procedural vote did not constitute a final rejection of the legislation. However, without an agreed path forward, regulatory developments could become another source of volatility in Q4.
Could XRP Reach $2 or $3 in Q4?
The broader recovery from August’s low near $1.00 has brought higher price targets back into market discussions, including $2 and $3.
However, those projections require several technical conditions that XRP has not yet satisfied.
The first milestone is a sustained recovery above $1.54, followed by a breakout through $1.60 to $1.70. The latter region has repeatedly capped XRP’s advances since August.
Above that, the next resistance area sits around $1.80 to $2.00, with additional supply near $2.20 to $2.40.
A $3 target is considerably more ambitious. XRP would need to establish support above $2, overcome the $2.20 to $2.40 resistance region and eventually clear approximately $2.75 before testing $3.
For the October 4 outlook, the immediate $1.45 support and $1.60 to $1.70 resistance levels remain more relevant than those longer-range projections.
| Scenario | What Would Support It | Levels to Watch |
| Bullish Case | XRP defends $1.45-$1.46, reclaims $1.54 and breaks above $1.70 | $1.80, then $1.93-$2.00 |
| Base Case | XRP holds $1.45 but continues struggling below $1.54-$1.60 | $1.45-$1.60 consolidation |
| Bearish Case | XRP loses $1.45 and fails to stabilize near its 200-day EMA | $1.37, then $1.20-$1.30 |
Table 2. XRP Bullish, Base and Bearish Scenarios
Bottom Line
XRP remains near $1.48, with declining trading volume and repeated resistance rejections keeping the short-term outlook neutral.
The immediate level to defend is $1.45 to $1.46. Holding that support leaves room for another attempt at $1.54, while clearing $1.60 to $1.70 would strengthen the broader recovery and bring $1.80 to $2.00 into focus.
A sustained break below $1.45 would instead increase the risk of a retest of $1.37, followed by the stronger $1.20 to $1.30 demand region.
For now, the $2 target remains conditional on buyers first regaining control above $1.70.
This article is for informational purposes only and does not constitute financial advice. Crypto price predictions are based on analyst estimates and are not guarantees of future performance. Do your own research before making any investment decisions.
Frequently Asked Questions
Need a refresher? Here are the questions most readers ask about XRP’s current price setup and Q4 outlook.
What Is XRP’s Main Support Right Now?
The immediate support sits around $1.45 to $1.46. Losing that area would expose the 200-day EMA near $1.37, followed by the broader $1.20 to $1.30 demand zone.
What Is XRP’s Main Resistance?
XRP faces immediate resistance around $1.54 to $1.55. The more important breakout zone remains between $1.60 and $1.70, where several previous rallies encountered selling.
How Much Did XRP ETFs Attract in September?
US spot XRP ETFs attracted approximately $121.4 million in net inflows during September. However, their combined net assets declined to around $1.69 billion by September 29 because XRP’s price fell during the period.
Why Is XRP Struggling to Break Above $1.50?
Recent trading has shown weaker volume and repeated selling near $1.54. XRP is also forming lower highs on the four-hour chart, indicating that buyers have not yet regained control of the short-term trend.
Can XRP Reach $2 in October?
A move toward $2 remains possible under a bullish scenario, but XRP must first defend $1.45, reclaim $1.54 and break the $1.60 to $1.70 resistance region. The next major upside area would then sit around $1.80 to $2.00, rather than $2 being an immediate target.


Be the first to comment