


As the market responded to a recent study by the Bank for International Settlements that placed the XRP Ledger in an uncommon institutional use case, verifying the veracity of official statistics, XRP gained about 3%.
XRPL’s BIS Release
The BIS released Working Paper No. 1374, ‘Blockchain-based approach for verifiable official statistics,’ on Sept. 2. A system that records a summary value on the XRP Ledger and generates cryptographic fingerprints of official datasets was created and tested by researchers.
Crucially, neither the banking nor the economic datasets were stored on XRPL in the experiment. Rather, the system anchored the resultant value to the ledger after hashing individual datasets and merging them when needed. Instead of the production mainnet, the prototype operated on the XRPL Devnet.

Verification times of one to two seconds and publication latency of approximately three to five seconds were reportedly produced by tests.
You Might Also Like

This distinction is important. The study does not imply that the BIS has partnered with Ripple, adopted XRP, or intends to switch central-bank infrastructure to XRPL. A technical proof of concept is what it is. However, by selecting XRPL as the public verification layer, researchers provide the network with an additional institutional point of reference outside of its more well-known payments narrative.
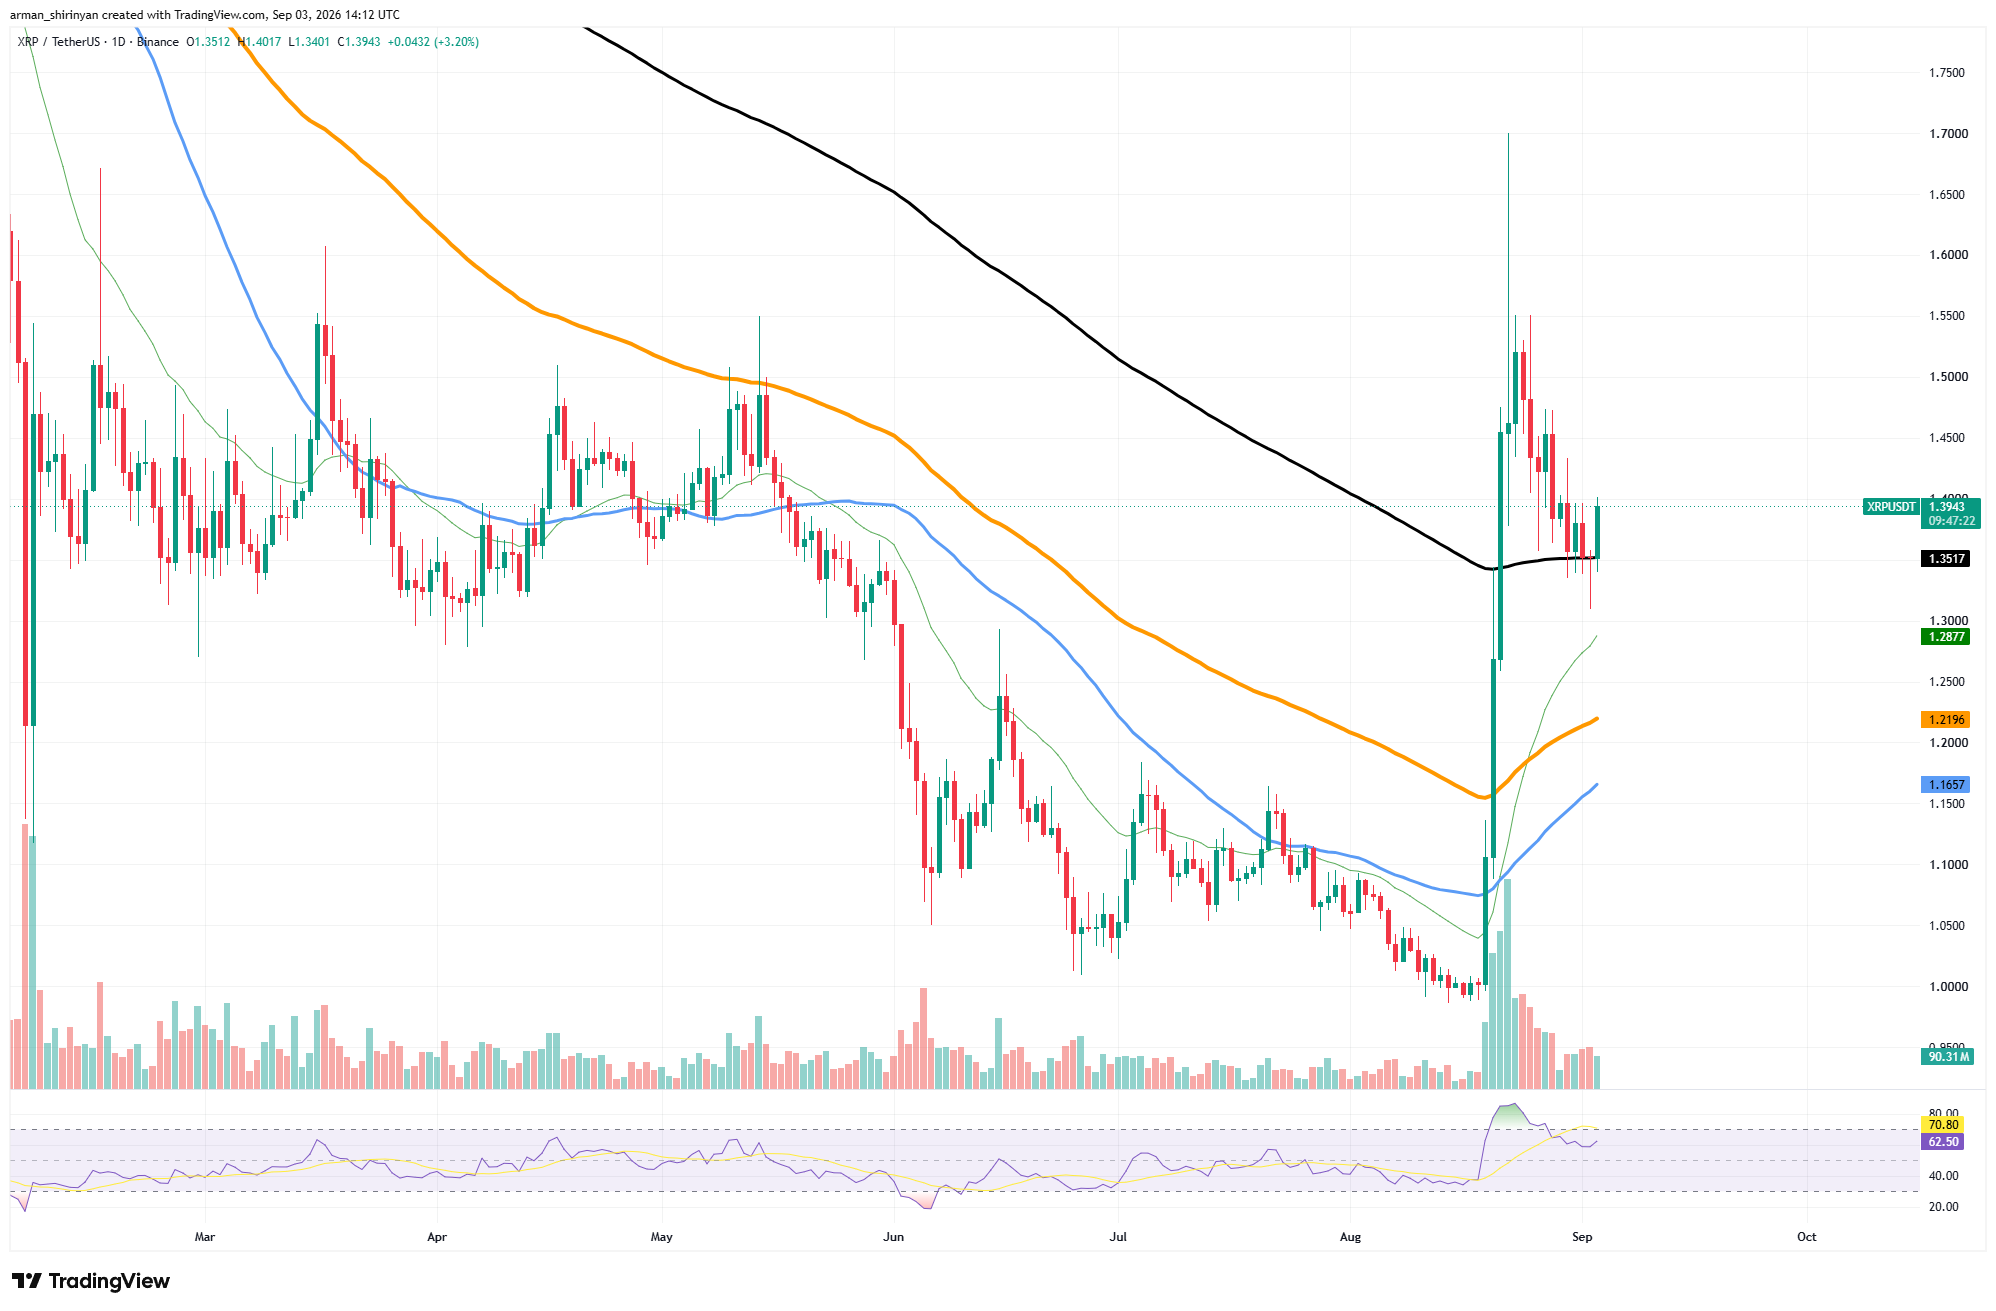
The XRP chart responded favorably. After recently correcting from the explosive August rally, the asset is currently trading at $1.39, up roughly 2.7% on the daily candle. More significantly, XRP is still at $1.35, slightly above its 200-day EMA. The immediate technical pivot is now that level.
Before profit-taking resumed, the initial breakout drove XRP as high as about $1.70. However, sellers have not yet been able to force a sustained move below the 200-day average. Moreover, momentum has stabilized. The RSI is currently close to 62, which is significantly below the extremely overbought conditions created during the initial breakout.
Maintaining the recovery structure at $1.35 would allow for another attempt at $1.45–$1.50, which would be followed by the recent highs. Losing it would significantly weaken the setup and highlight the shorter moving average around $1.29.
Ethereum Gets Ready
Ethereum’s most recent breakout fundamentally altered the daily chart’s structure, bringing it closer to a technically significant moving-average crossover.
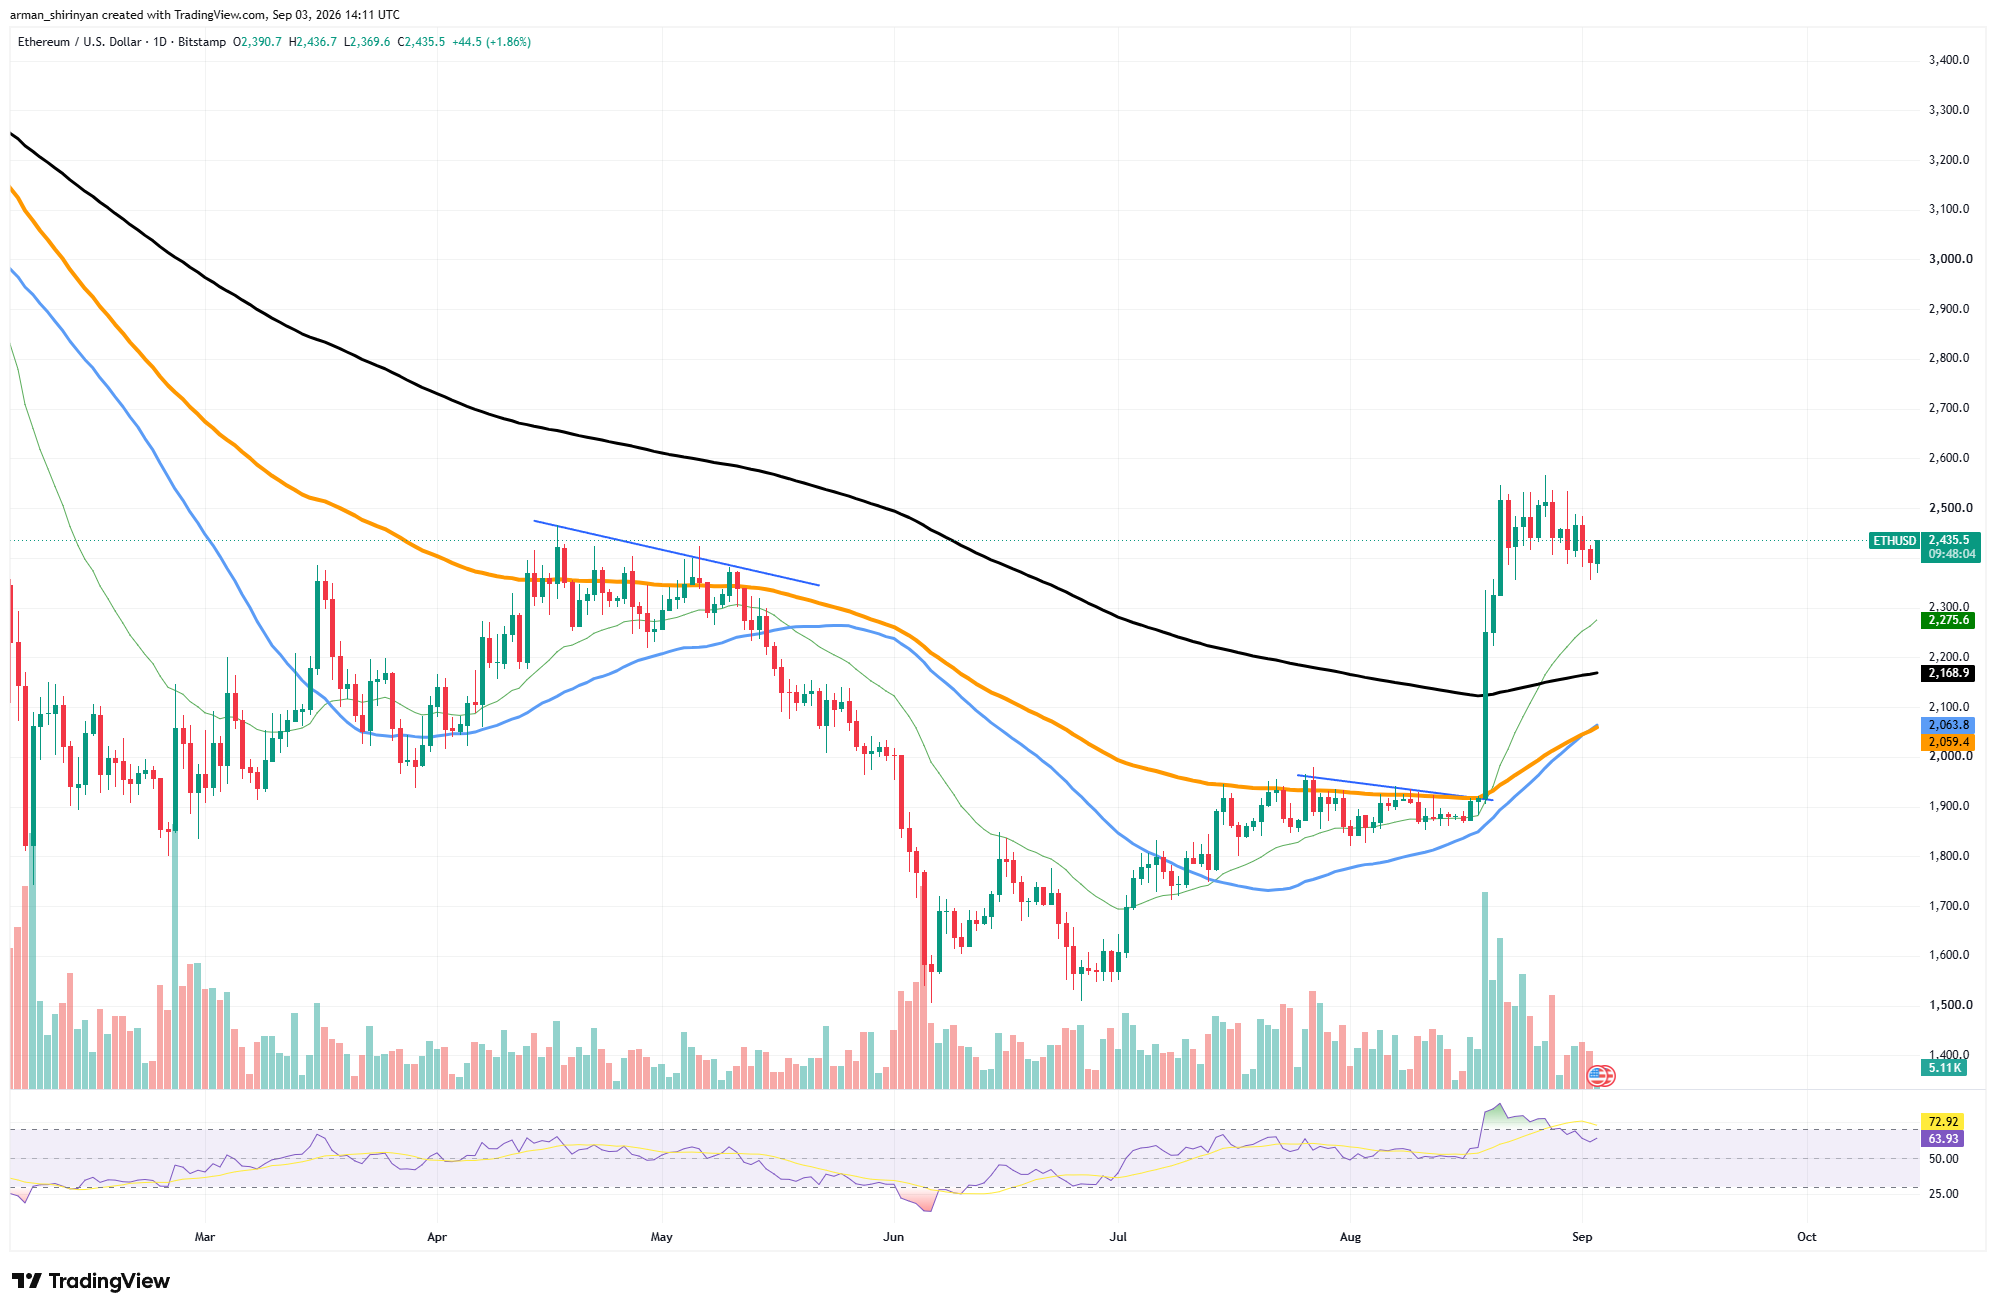
ETH’s medium-term moving averages are quickly converging below the market, and it is currently trading at about $2,420. With the 50-day EMA at $2,063 moving toward the 100-day EMA at $2,059, the setup is similar to a pre-golden-cross formation. The gap between the two averages, which was significantly larger during Ethereum’s summer weakness, has now shrunk to just a few dollars.
Another improvement in medium-term momentum would be confirmed if the 50-day EMA crossed over the 100-day EMA. Moving-average crossovers lag price, which is a crucial disclaimer. Since ETH has already surged from about $1,880 to over $2,500 at the local peak, a large portion of the momentum that caused the crossover has already occurred. Therefore, a golden cross does not always signal the start of a new rally.
You Might Also Like

Nevertheless, the signal is much stronger due to the surrounding price structure. With a massive increase in volume, Ethereum broke through the $1,900–$1,920 resistance range and quickly recovered its main moving averages. Above all, ETH broke through the 200-day EMA at $2,169, which had served as a significant long-term resistance level during the previous decline.
Since then, the market has pulled back from roughly $2,550, but the decline is still largely under control. ETH is still trading significantly above the 50-day and 100-day averages, as well as more than 10% above the 200-day EMA.
Additionally, momentum has decreased. After reaching overbought territory during the breakout, the daily RSI has dropped toward 63. This eliminates a portion of the current overheating while maintaining the larger bullish structure.
The $2,500–$2,550 range continues to be Ethereum’s first upside obstacle. The path toward $2,600 and possibly $2,700 could be opened by a daily close above this range, which would create another higher high.
On the downside, bulls must defend the immediate area between $2,360 and $2,400. Although it would significantly lessen short-term momentum, a deeper correction toward the 200-day EMA at $2,170 would still make the larger recovery technically feasible.
Tron Is Back in the Spotlight
With the total value locked throughout the ecosystem rising to roughly $28 billion, Tron has achieved yet another significant network milestone. Even though TRX has a more difficult technical setup, the figure supports Tron’s standing as one of the biggest blockchain networks in terms of capital deployed.
The value of cryptocurrency assets deposited across a network’s protocols is measured by TVL. Along with staking and lending infrastructure, Tron’s massive stablecoin economy, especially USDT, provides a significant amount of that capital. Therefore, rather than just reflecting speculative activity around TRX, the $28 billion figure represents significant capital utilization.
The stablecoin position of Tron is still very significant. Users prefer the network for quick and reasonably priced transfers, making it one of the main settlement layers for USDT transfers worldwide. In contrast to many rival Layer-1 networks, this gives Tron a reliable source of transactional demand.
You Might Also Like

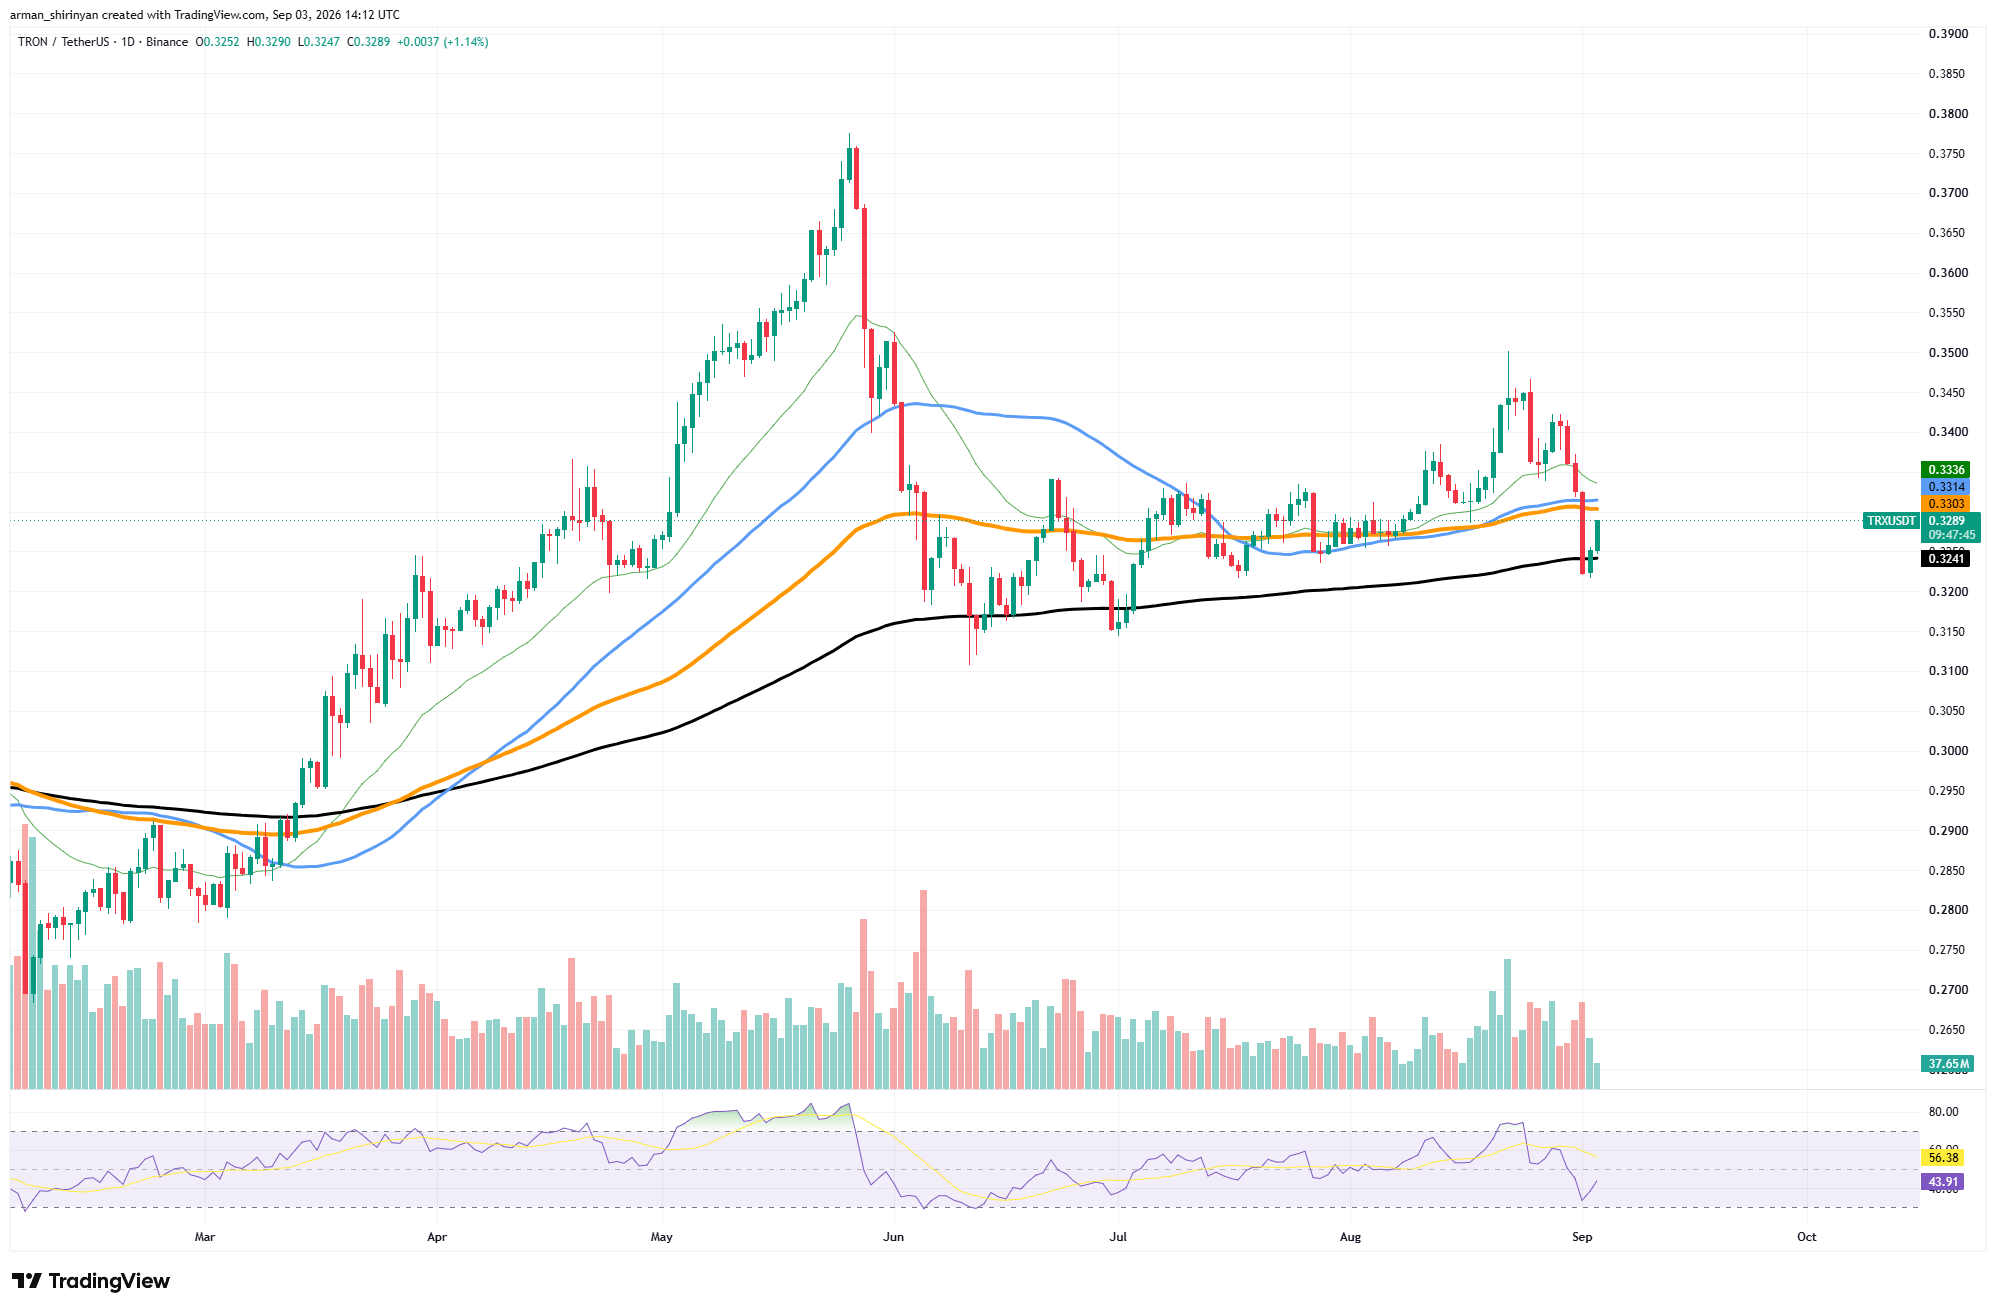
TRX’s price has not, however, immediately increased in response to the TVL milestone. After a severe rejection from the recent local peak at $0.345–$0.350, TRX is currently trading at $0.328. More significantly, the asset fell below a number of short- and medium-term moving averages that were closely grouped between roughly $0.330 and $0.334. As a result, there is a sizable resistance cluster right above the current price.
The crucial technical level at this time is the 200-day EMA at $0.324. During the most recent sell-off, TRX briefly moved below it before rising above the indicator. The larger bullish structure that was formed earlier this year would be preserved if this level were maintained.
Momentum has significantly diminished. When compared to overbought readings from the previous rally, the RSI has dropped toward 43. Despite the fact that TRX is far from being extremely oversold, this suggests that buyers have lost short-term control.
The first significant bullish signal would be a recovery above $0.334, which could reintroduce $0.340–$0.350. On the other hand, a confirmed breakdown below $0.324 would expose the $0.315–$0.320 area and might eliminate a significant portion of the recent gains.
A strong fundamental backdrop is provided by Tron’s $28 billion TVL, but for that network strength to result in a convincing price recovery, TRX must now defend its 200-day EMA.



Be the first to comment