


TLDR
- XRP dropped below $1.20 and hit a low of $1.1401 in recent trading.
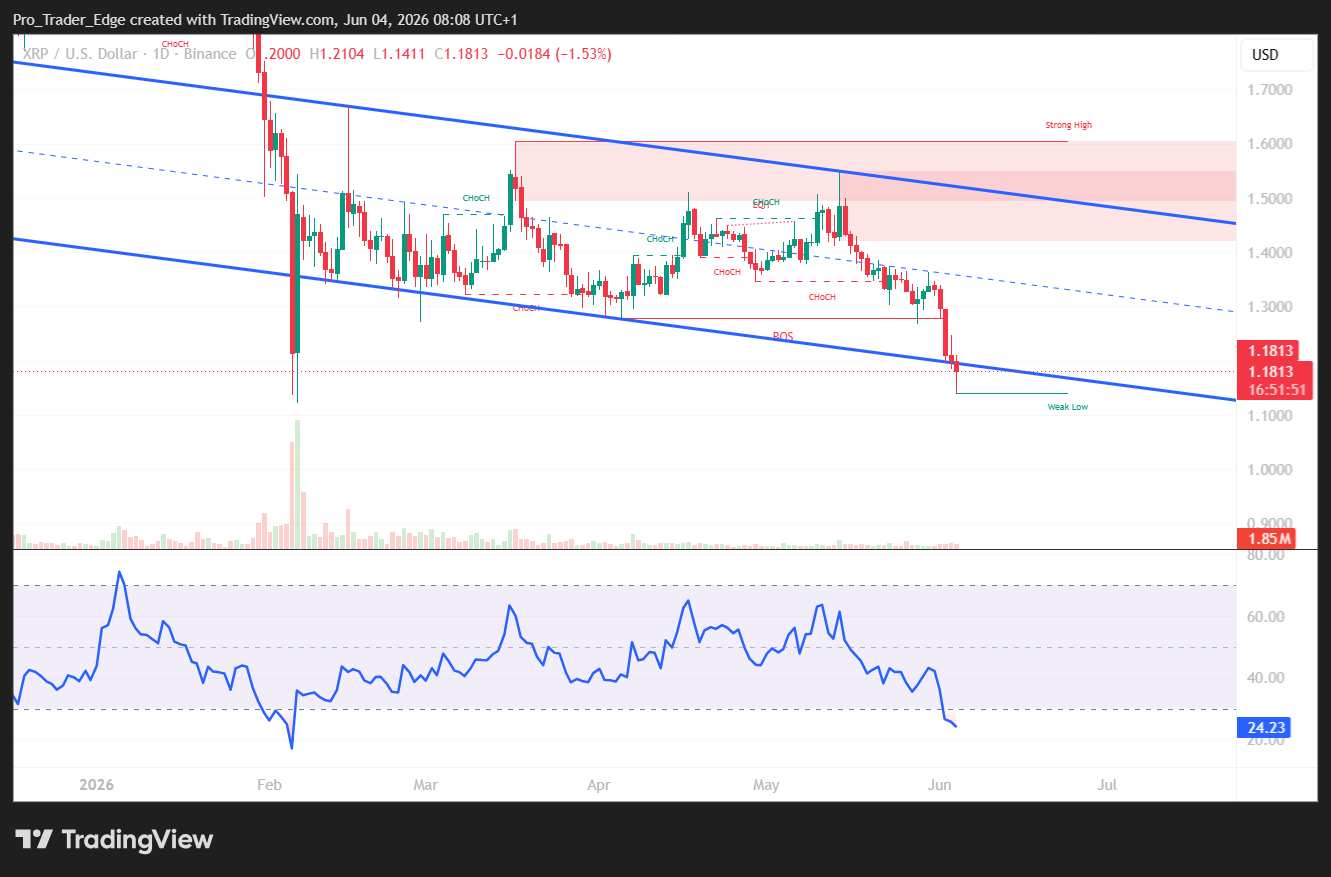
- The price is below the 100-hourly Simple Moving Average, confirming short-term bearish momentum.
- RSI indicators show oversold conditions, hinting at a possible short-term bounce.
- Bulls need a close above $1.1950 to start any recovery, with $1.32 the key level to watch.
- Analyst ChartNerd warns of a potential drop to the $0.84 Middle Regression Band if current levels don’t hold.
XRP has been under steady selling pressure over the past several days, falling alongside Bitcoin and Ethereum in a broader market decline.
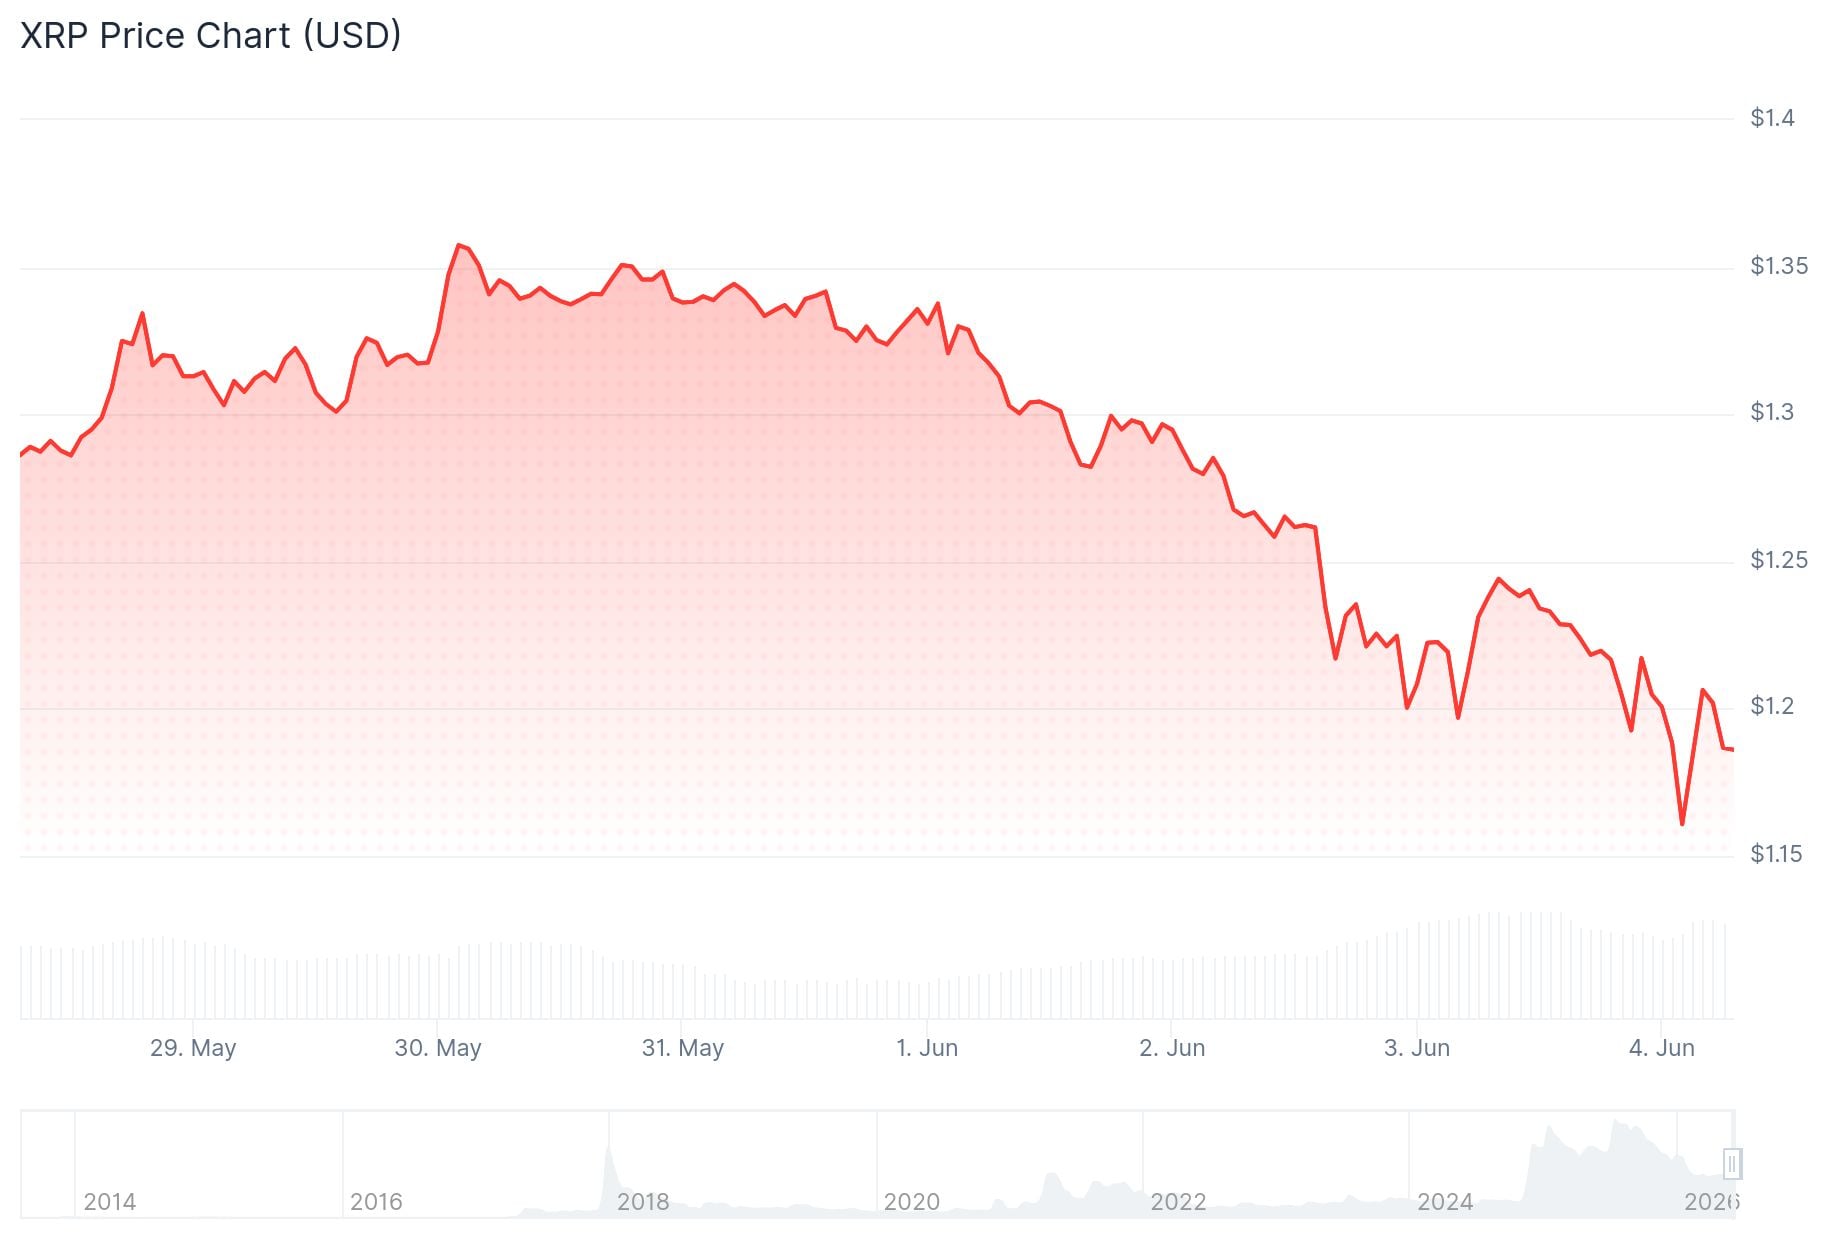
The price broke below the $1.20 level and extended its drop all the way to a low of $1.1401. It is now consolidating in the $1.15–$1.20 range, sitting below the 100-hourly Simple Moving Average.
At press time, XRP is trading around $1.22, up roughly 1% over the past 24 hours.
On the hourly chart, a bearish trend line has formed with resistance sitting at $1.1950. The price has also failed to reclaim the 23.6% Fibonacci retracement level of the move from the $1.3640 swing high down to the $1.1401 low.
For a recovery to gain traction, XRP would first need to break and close above $1.1950. A move above that level could open the door to $1.20, then $1.22, and eventually $1.25.
Bulls Need $1.32 to Shift the Trend
The next key line in the sand for XRP bulls is $1.32. A strong close above that level could set up a rally toward $1.43, representing a roughly 17% gain from current levels.
However, the MACD indicator still shows negative histogram bars, which supports the current bearish outlook. Until technical confirmation arrives, both bullish and bearish outcomes remain on the table.

XRP is being used primarily as a cross-border payment token, and the XRP community has been discussing what some are calling an “XRP Supercycle” — a narrative that prices could surge sharply. But price action has not yet confirmed that view.
Crypto analyst ChartNerd (@ChartNerdTA) posted a warning on X, noting that XRP has broken below the Upper Regression Band at $1.35 on the Gaussian Channel. He pointed out that historically, every time XRP has broken below that band, the price has pulled back to the Middle Regression Band, currently sitting at $0.84. His view is that the 2026 “homecoming” to that level remains on track.
🎯 $XRP Update: We are now losing the Upper Regression Band ($1.35). History across the Gaussian Channel shows that every prior break below the upper band has led to a clear retrace toward the Middle Regression Band ($0.84). The 2026 “homecoming” remains firmly on track 🏡 https://t.co/KJXtjWKtNb pic.twitter.com/qDWtIrtyWk
— 🇬🇧 ChartNerd 📊 (@ChartNerdTA) June 3, 2026
Key Support Levels to Watch
On the downside, initial support sits near $1.16, followed by $1.155. If XRP loses $1.155, the next levels to watch are $1.15 and $1.144.
A break below $1.144 would open up a move toward $1.14 and potentially lower.
The RSI remains in oversold territory, which could attract short-term buyers. But oversold conditions alone do not reverse a trend without a price catalyst.
XRP last touched $1.1401 during this recent decline, forming the current swing low.

Be the first to comment