


TLDR
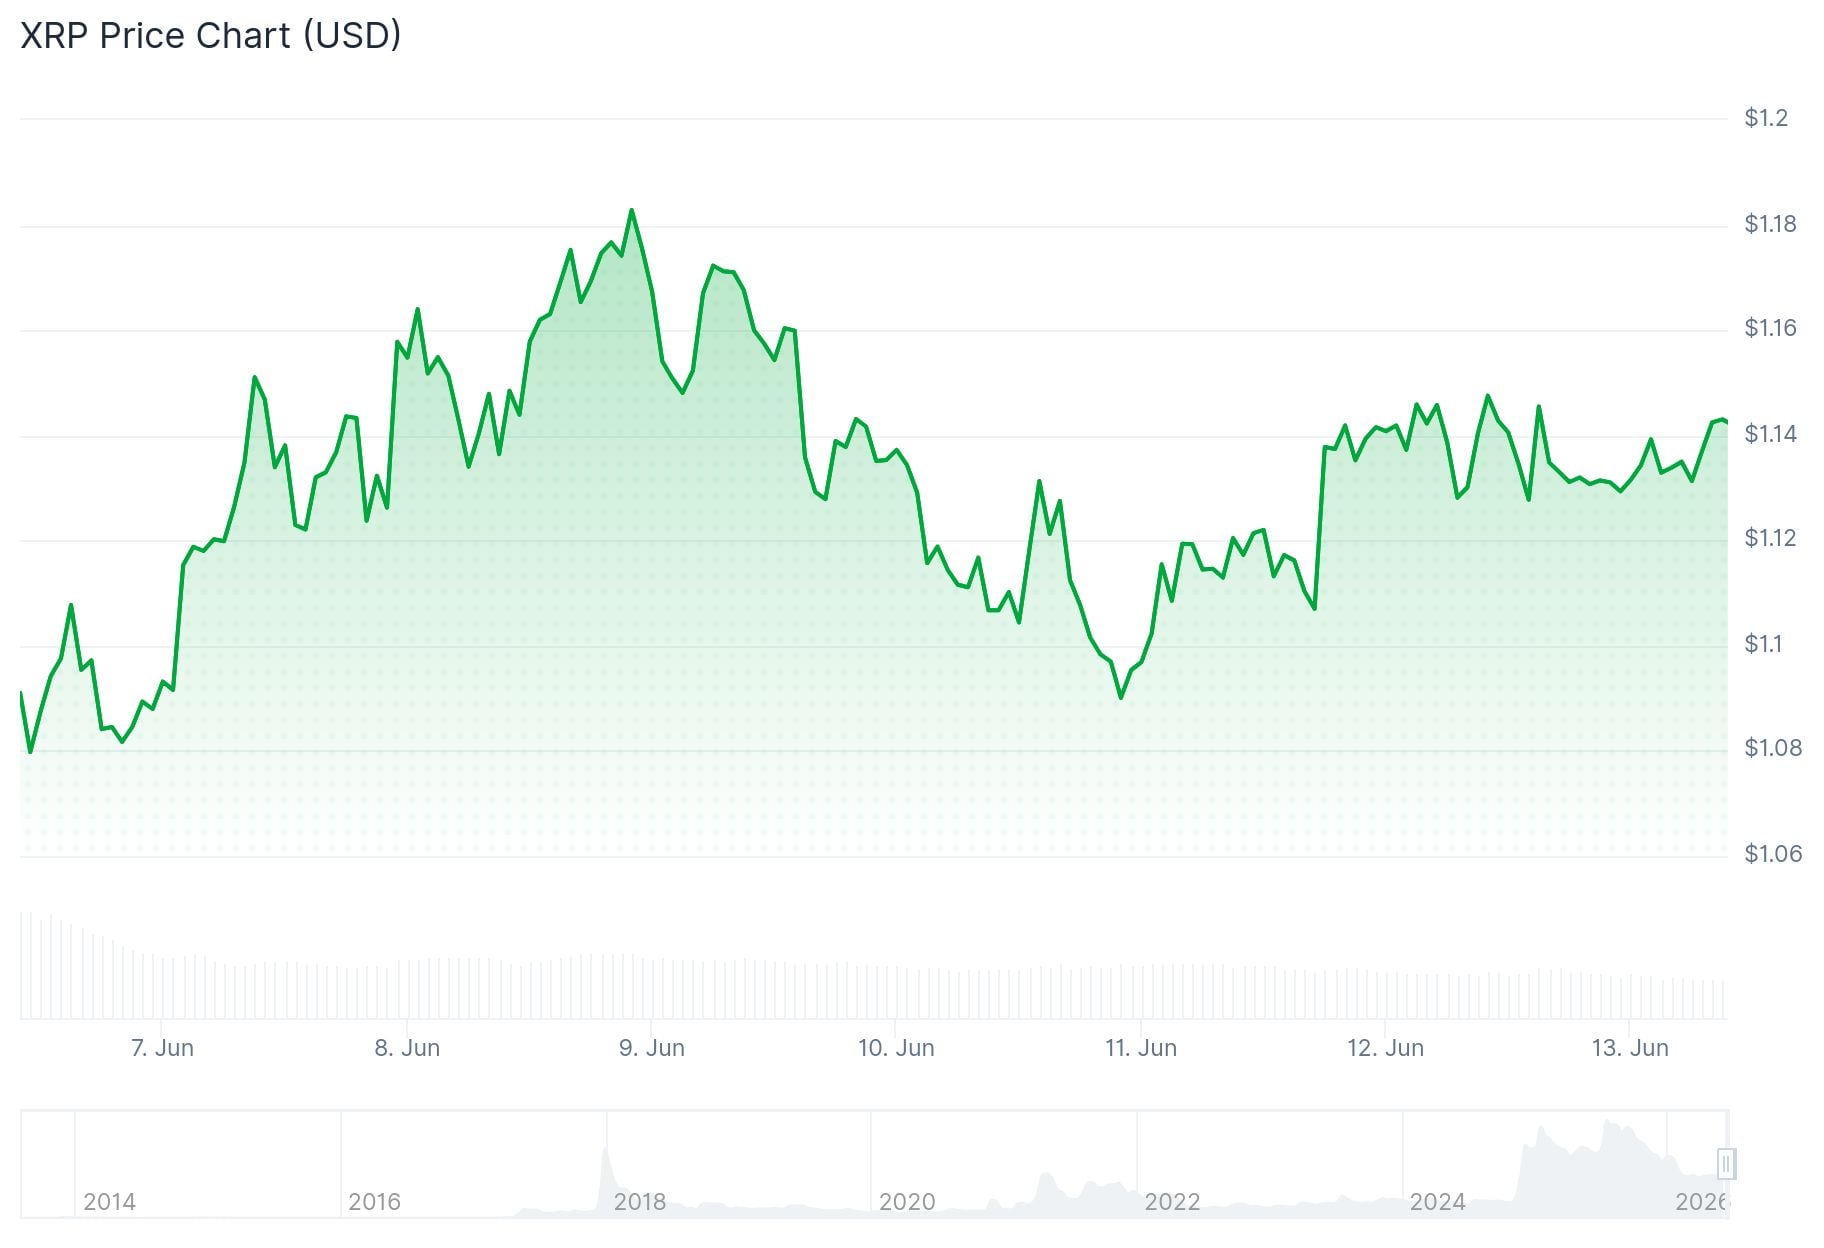
- XRP is holding above $1.14 support after briefly dipping to $1.05 during a recent market correction
- A bullish RSI divergence has formed, with analysts targeting a move toward $1.30
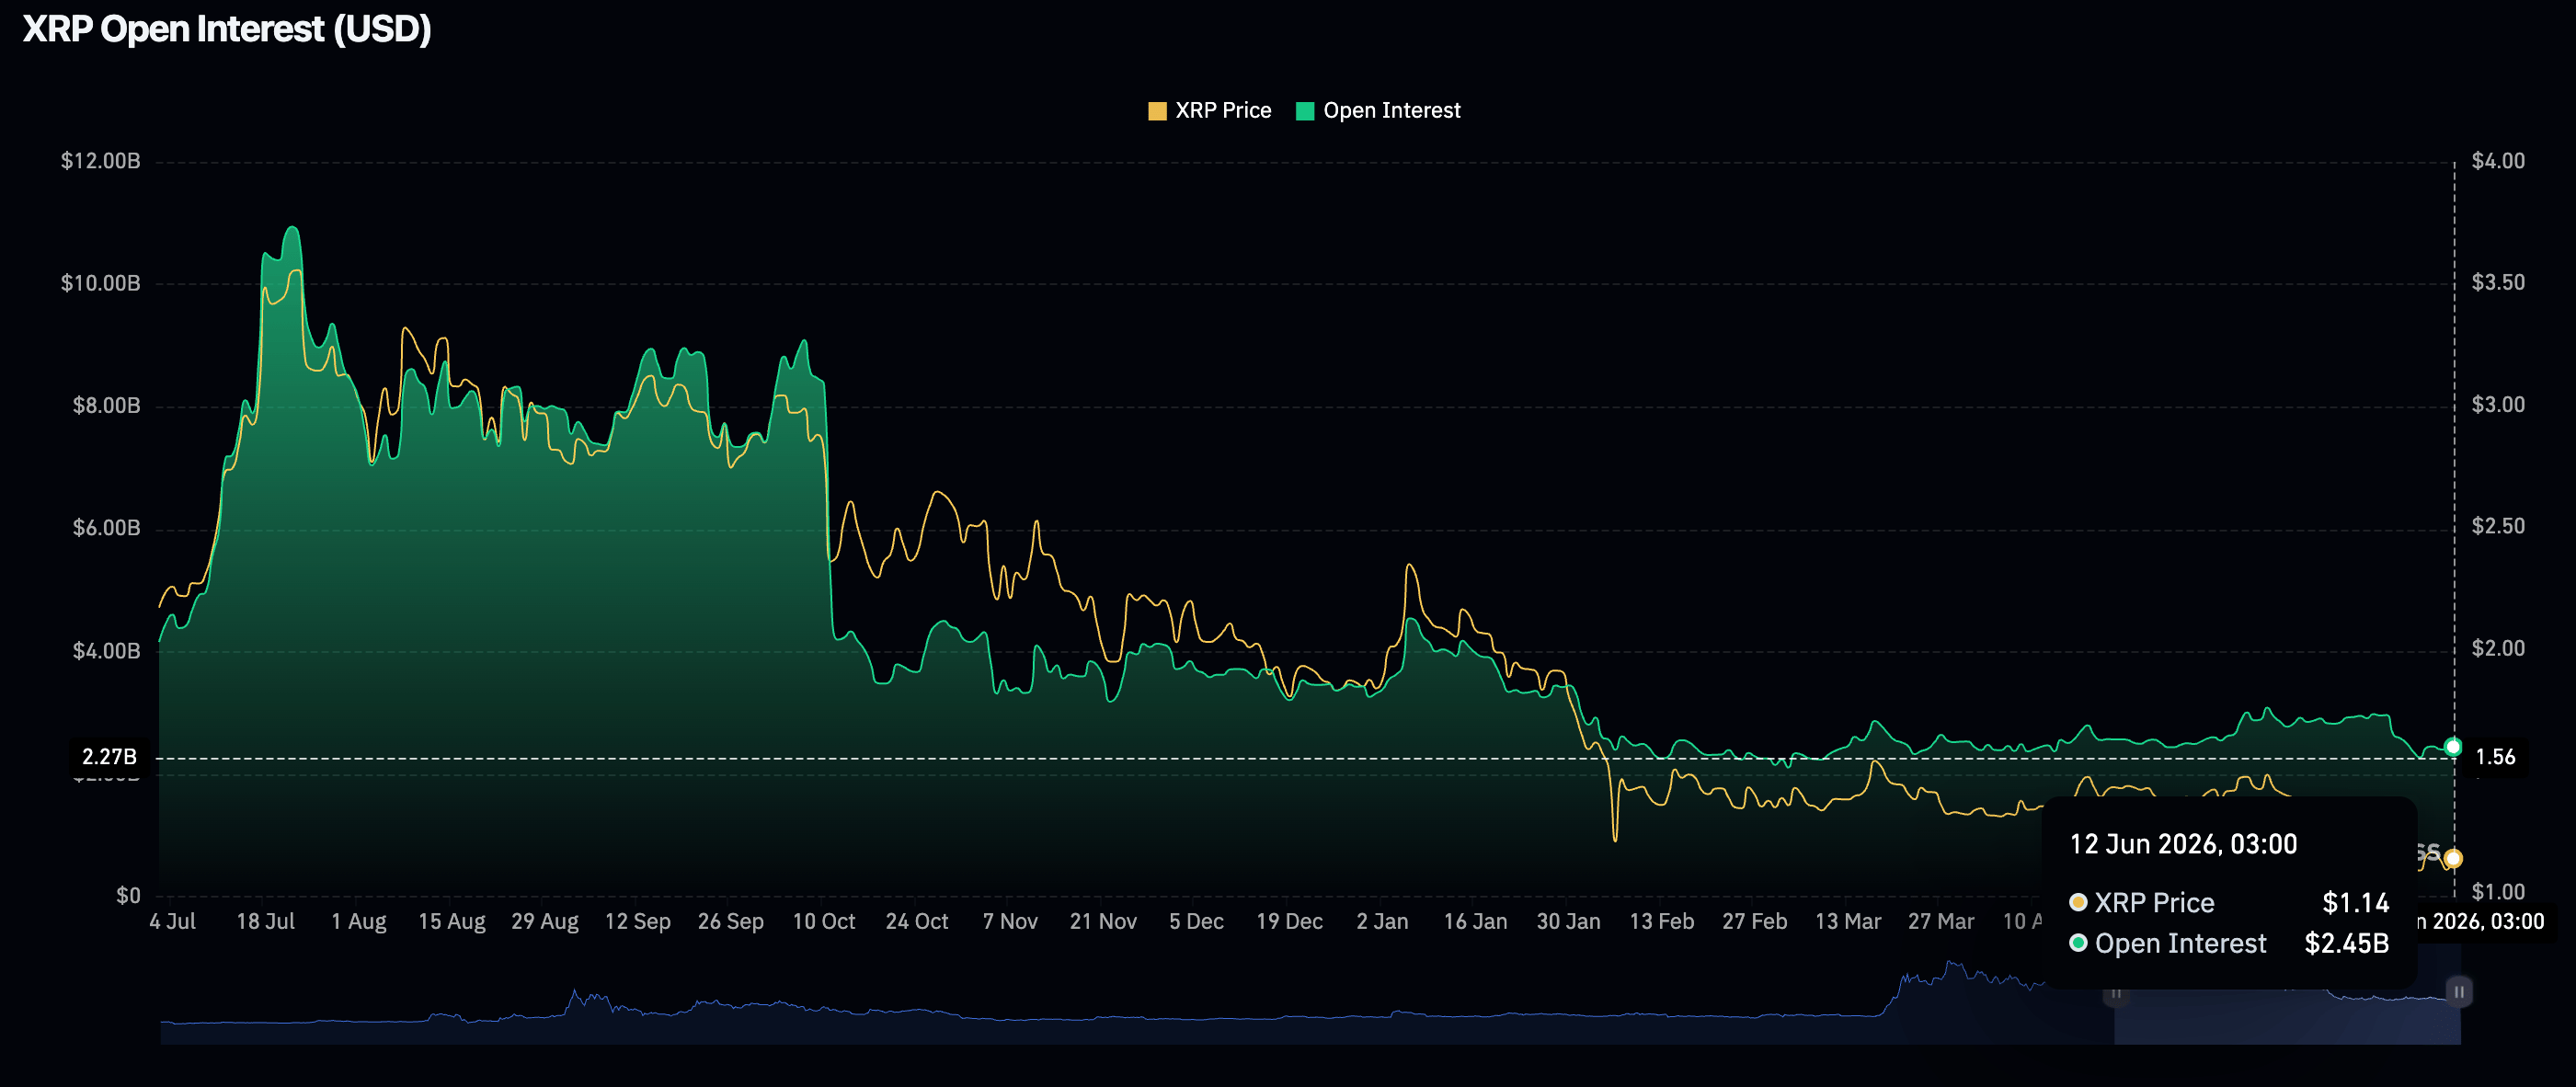
- Futures Open Interest has dropped to $2.45 billion, down from $2.96 billion earlier in June
- XRP ETF inflows have been mixed, with zero flows recorded Thursday; cumulative inflows sit at $1.43 billion
- XRP trades below all major moving averages, with the 50-day EMA near $1.30 acting as key resistance
Ripple’s XRP token is trading around $1.14 after bouncing off a June low of $1.05. The price dip triggered stop losses and forced leveraged traders out of positions before buyers stepped back in.
Market analyst CryptoPulse described the move as a “capitulation flush,” saying the sweep of the $1.13 support zone was a necessary reset before any recovery could start.
$XRP is starting to show some interesting signs.
We’re seeing bullish divergence develop while price remains well below VWAP, a combination that often gets us paying attention. Usually when this happens, price will gravitate back toward the average
If momentum continues to… pic.twitter.com/y8qsOqSuGx
— CryptoPulse (@CryptoPulse_CRU) June 12, 2026
The recovery has drawn attention to a technical pattern forming on the Relative Strength Index. While price made a lower low, the RSI formed a higher low — a bullish divergence that suggests selling pressure may be slowing.
Derivatives and ETF Demand Cool
Futures Open Interest averaged $2.96 billion on June 1 but has since dropped to $2.45 billion. That decline points to fewer traders opening new positions, showing reduced confidence in a near-term rally.
XRP spot ETF flows have been uneven. Inflows hit $7.44 million on Tuesday and $1.2 million on Wednesday, but Thursday saw zero flows. Cumulative ETF inflows stand at $1.43 billion, with net assets under management at $985 million.
Analyst ChartNerd flagged a key development on the two-week chart. The price has returned to the lower regression band of the Gaussian Channel at $1.04, a level that has appeared at similar points in prior cycles. ChartNerd described it as “the land of macro opportunity” and said the behavior has consistently repeated in previous market cycles.

One of our $XRP signals just fired! 👏
Price has returned home to the lower regression band of the Gaussian Channel on the 2W timeframe ($1.04). This behaviour consistently repeated during prior cycles and we mapped it again in 2026.
Welcome to the land of macro opportunity 🥂 https://t.co/jV1vKoUOxK pic.twitter.com/nCxOPv3GwQ
— 🇬🇧 ChartNerd 📊 (@ChartNerdTA) June 12, 2026
Moving Averages Remain a Barrier
XRP is still trading below its 10-day, 50-day, 100-day, and 200-day exponential moving averages. The 50-day EMA sits near $1.30, which also lines up with the key resistance level analysts are watching.
The 100-day EMA is near $1.39, while the 200-day EMA sits around $1.61. These levels form a broad supply zone that would need to be cleared for a sustained recovery.
The RSI (14) reads 35.10, not yet in oversold territory but approaching it. The MACD remains slightly negative at -0.06656. The Momentum (10) indicator has flipped to a Buy signal, which may indicate short-term selling is slowing.
TradingView data shows the overall technical summary rated as Neutral, with 14 Sell signals, 10 Neutral, and just 2 Buy signals.
An Elliott Wave analysis suggests XRP may be completing a Wave (2) correction within a larger Cycle Wave V structure. The identified accumulation zone falls between the 50% and 61.8% Fibonacci levels, roughly $1.19 to $0.91. Analysts put a 65-70% probability on the macro bullish structure remaining intact.
XRP was trading at around $1.14, up 3.06% in the past 24 hours at time of writing.

Be the first to comment