


XRP price traded near $1.45 on Sept. 4 after breaking above a falling 4-hour channel, but resistance between $1.50 and $1.53 remains the next test for buyers.
Summary
- XRP price broke above a descending 4-hour channel after rebounding from support near $1.33.
- Daily RSI stands at 66.22, showing strong momentum without reaching the 70 overbought level.
- Liquidation clusters sit near $1.43 below price and between $1.48 and $1.53 above it.
- The Sept. 15 CLARITY Act vote and US inflation data could determine the next move.
XRP price action today
According to data from crypto.news, XRP (XRP) price was changing hands near $1.45 on Friday, consolidating after a sharp recovery from its early September low near $1.33.

The token briefly reached approximately $1.47 during the latest advance before losing some momentum. Even so, the pullback has remained shallow compared with the size of the breakout.
XRP’s 4-hour chart shows that price has moved above the upper boundary of a descending channel that had guided the market lower since its Aug. 22 rally. The channel formed after XRP spiked to a local high near $1.70 and then recorded a series of lower highs and lower lows.
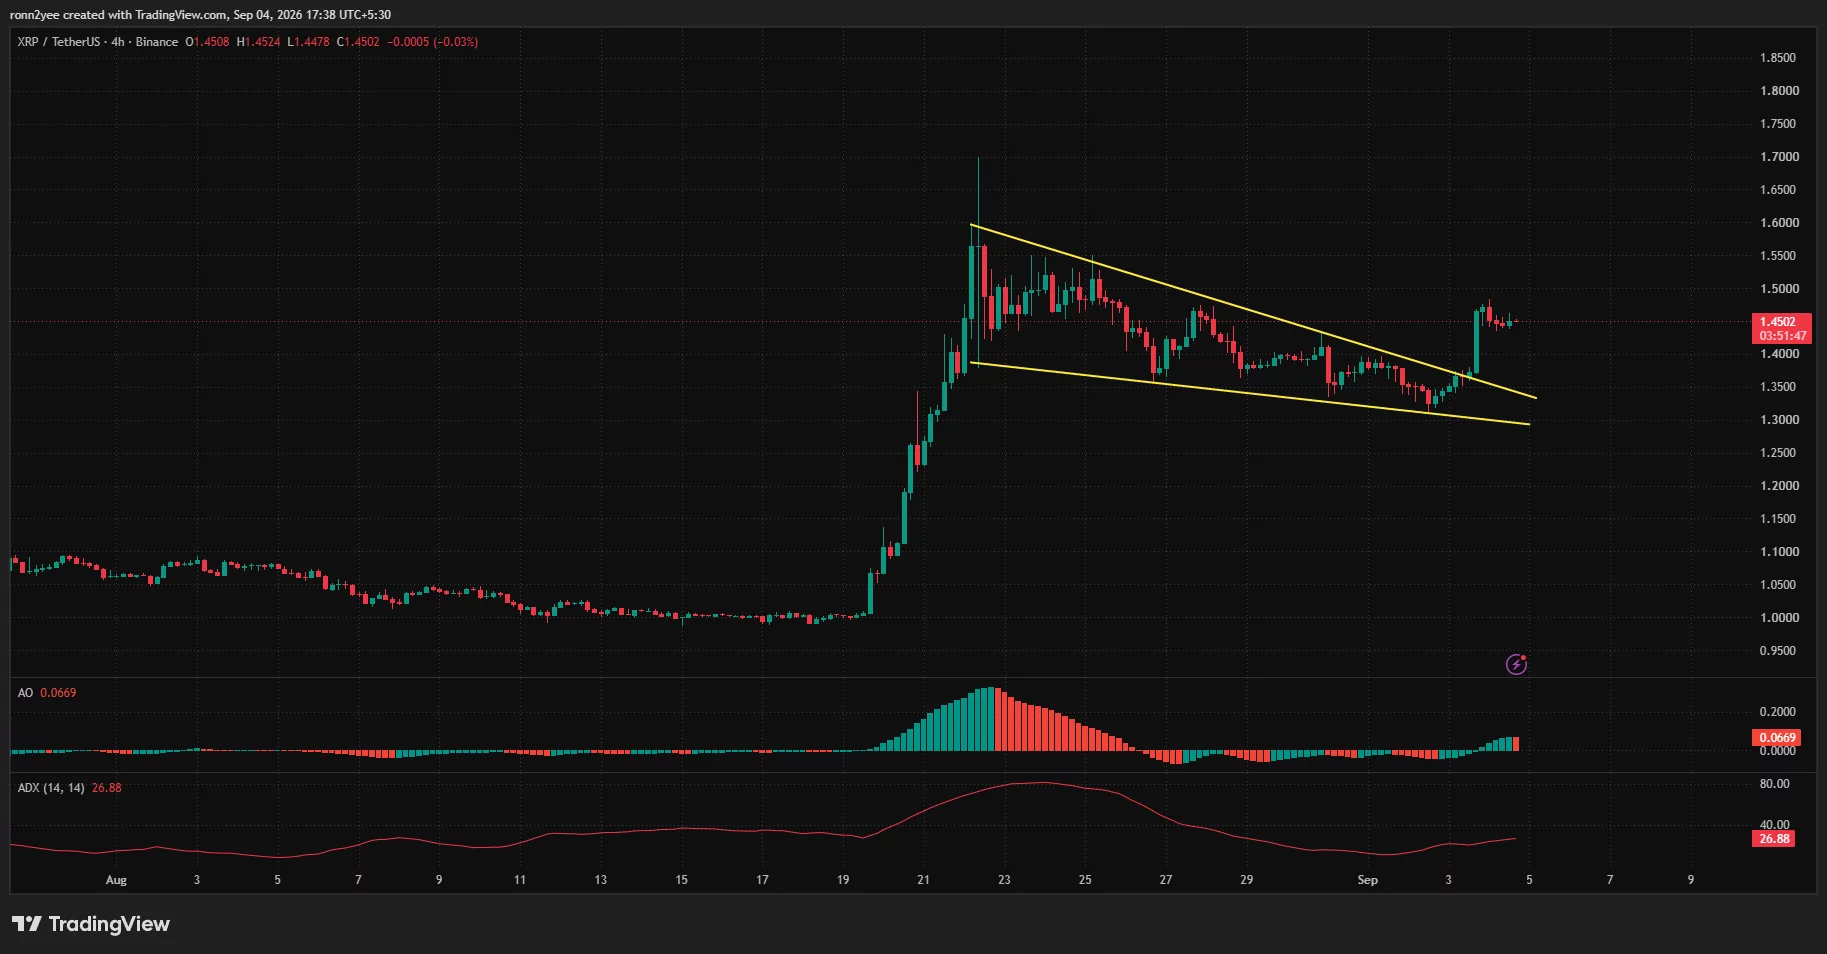
The breakout occurred near $1.37 and was followed by a rapid move above $1.45. XRP is now holding above the former channel resistance, leaving the short-term bullish structure intact while that level remains defended.
The Awesome Oscillator stands at 0.0669 and continues to print positive bars. The reading indicates that short-term momentum remains stronger than longer-term momentum, although the latest bars show that the initial acceleration may be slowing.
The Average Directional Index has climbed to 26.88. An ADX reading above 25 normally points to a developing directional trend, giving the channel breakout more weight than a move occurring under weak trend conditions.
XRP faces resistance at $1.50 and $1.53
The first major barrier sits between $1.48 and $1.50, where XRP repeatedly struggled to hold gains following its August surge. A 4-hour close above the zone could allow buyers to challenge the descending channel’s starting area near $1.55.
The daily chart places additional resistance at $1.53. Crypto analyst ChartNerd identified that level as XRP’s 50-week exponential moving average, while the 20-week EMA sits much lower at approximately $1.28.
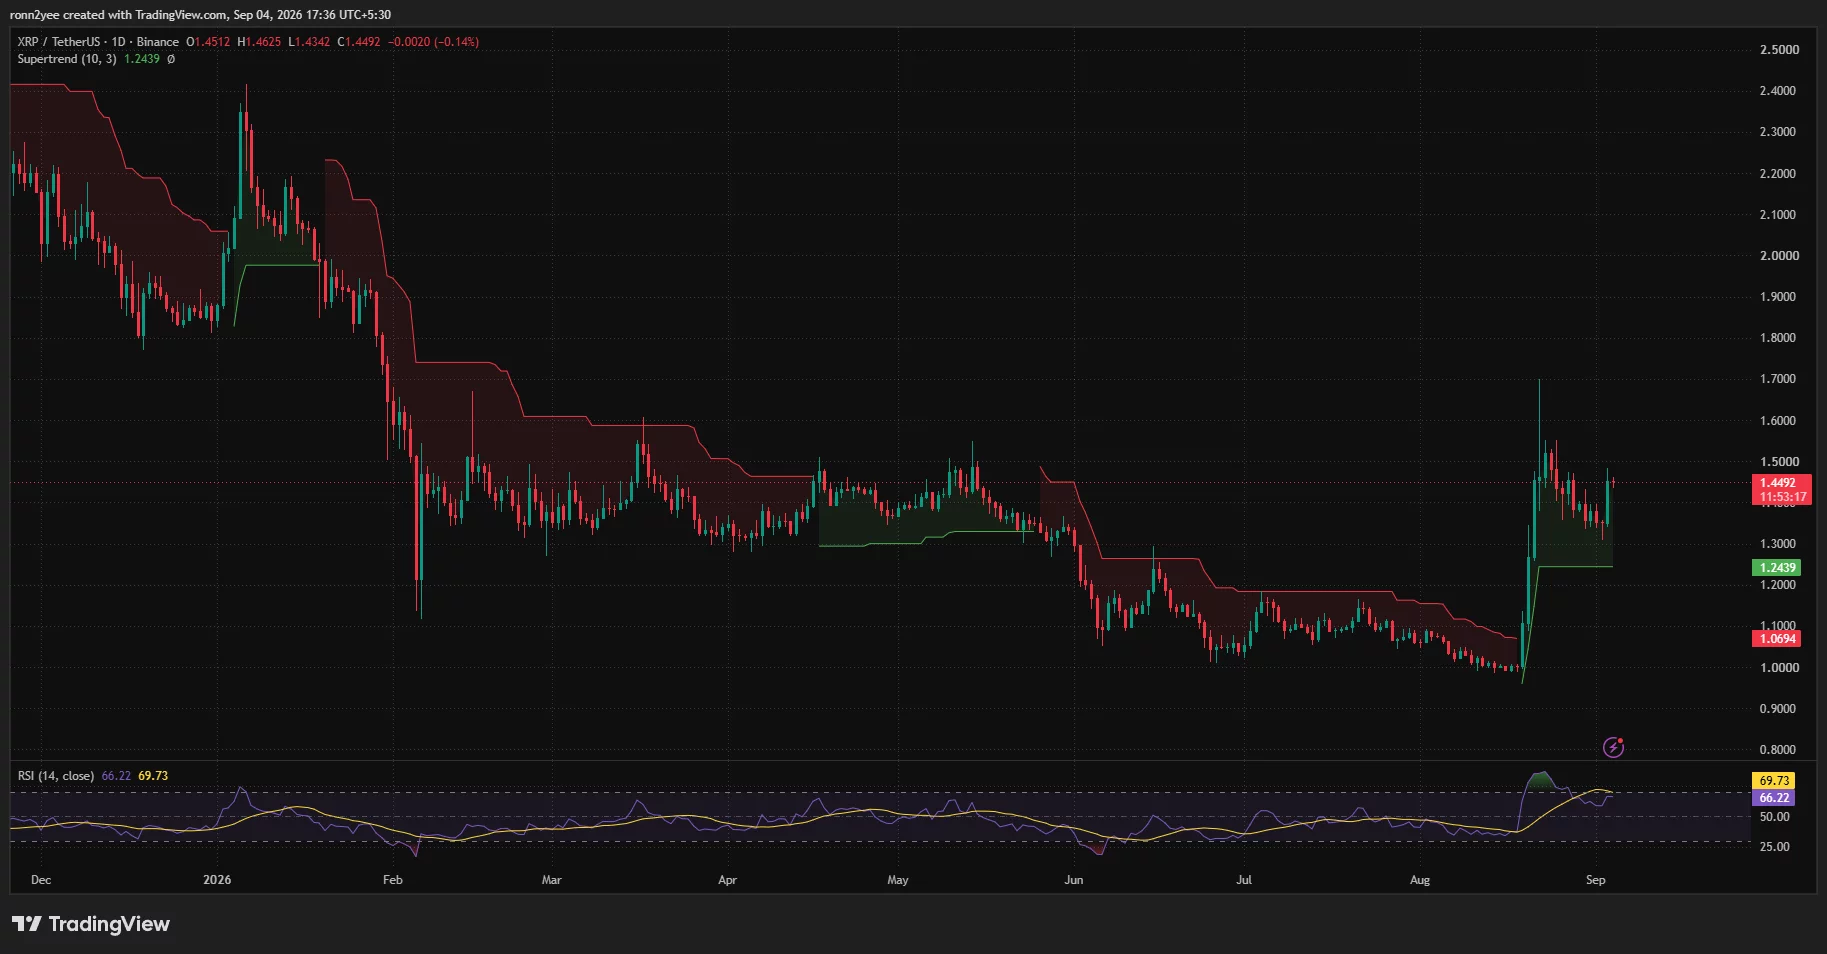
According to ChartNerd, XRP remains inside a large weekly compression range between the two averages. The analyst said a convincing move above the 50-week EMA could open the way toward $1.80, while repeated weekly closes below it would raise the risk of a deeper retracement.
Daily momentum supports another resistance test but also calls for some caution. XRP’s 14-day Relative Strength Index is at 66.22, below its signal average of 69.73 and just under the conventional overbought threshold of 70.
The reading shows that buyers still control the broader move, although momentum has cooled since XRP reached $1.70. A push above 70 alongside a price close over $1.53 would provide stronger confirmation that the recovery is extending.
Liquidation map puts $1.43 support in focus
CoinGlass’ three-day XRP liquidation heatmap shows the nearest large concentration of leveraged positions around $1.425 to $1.435. That liquidity sits just below the current market price and could attract a short-term sweep if XRP fails to hold $1.45.
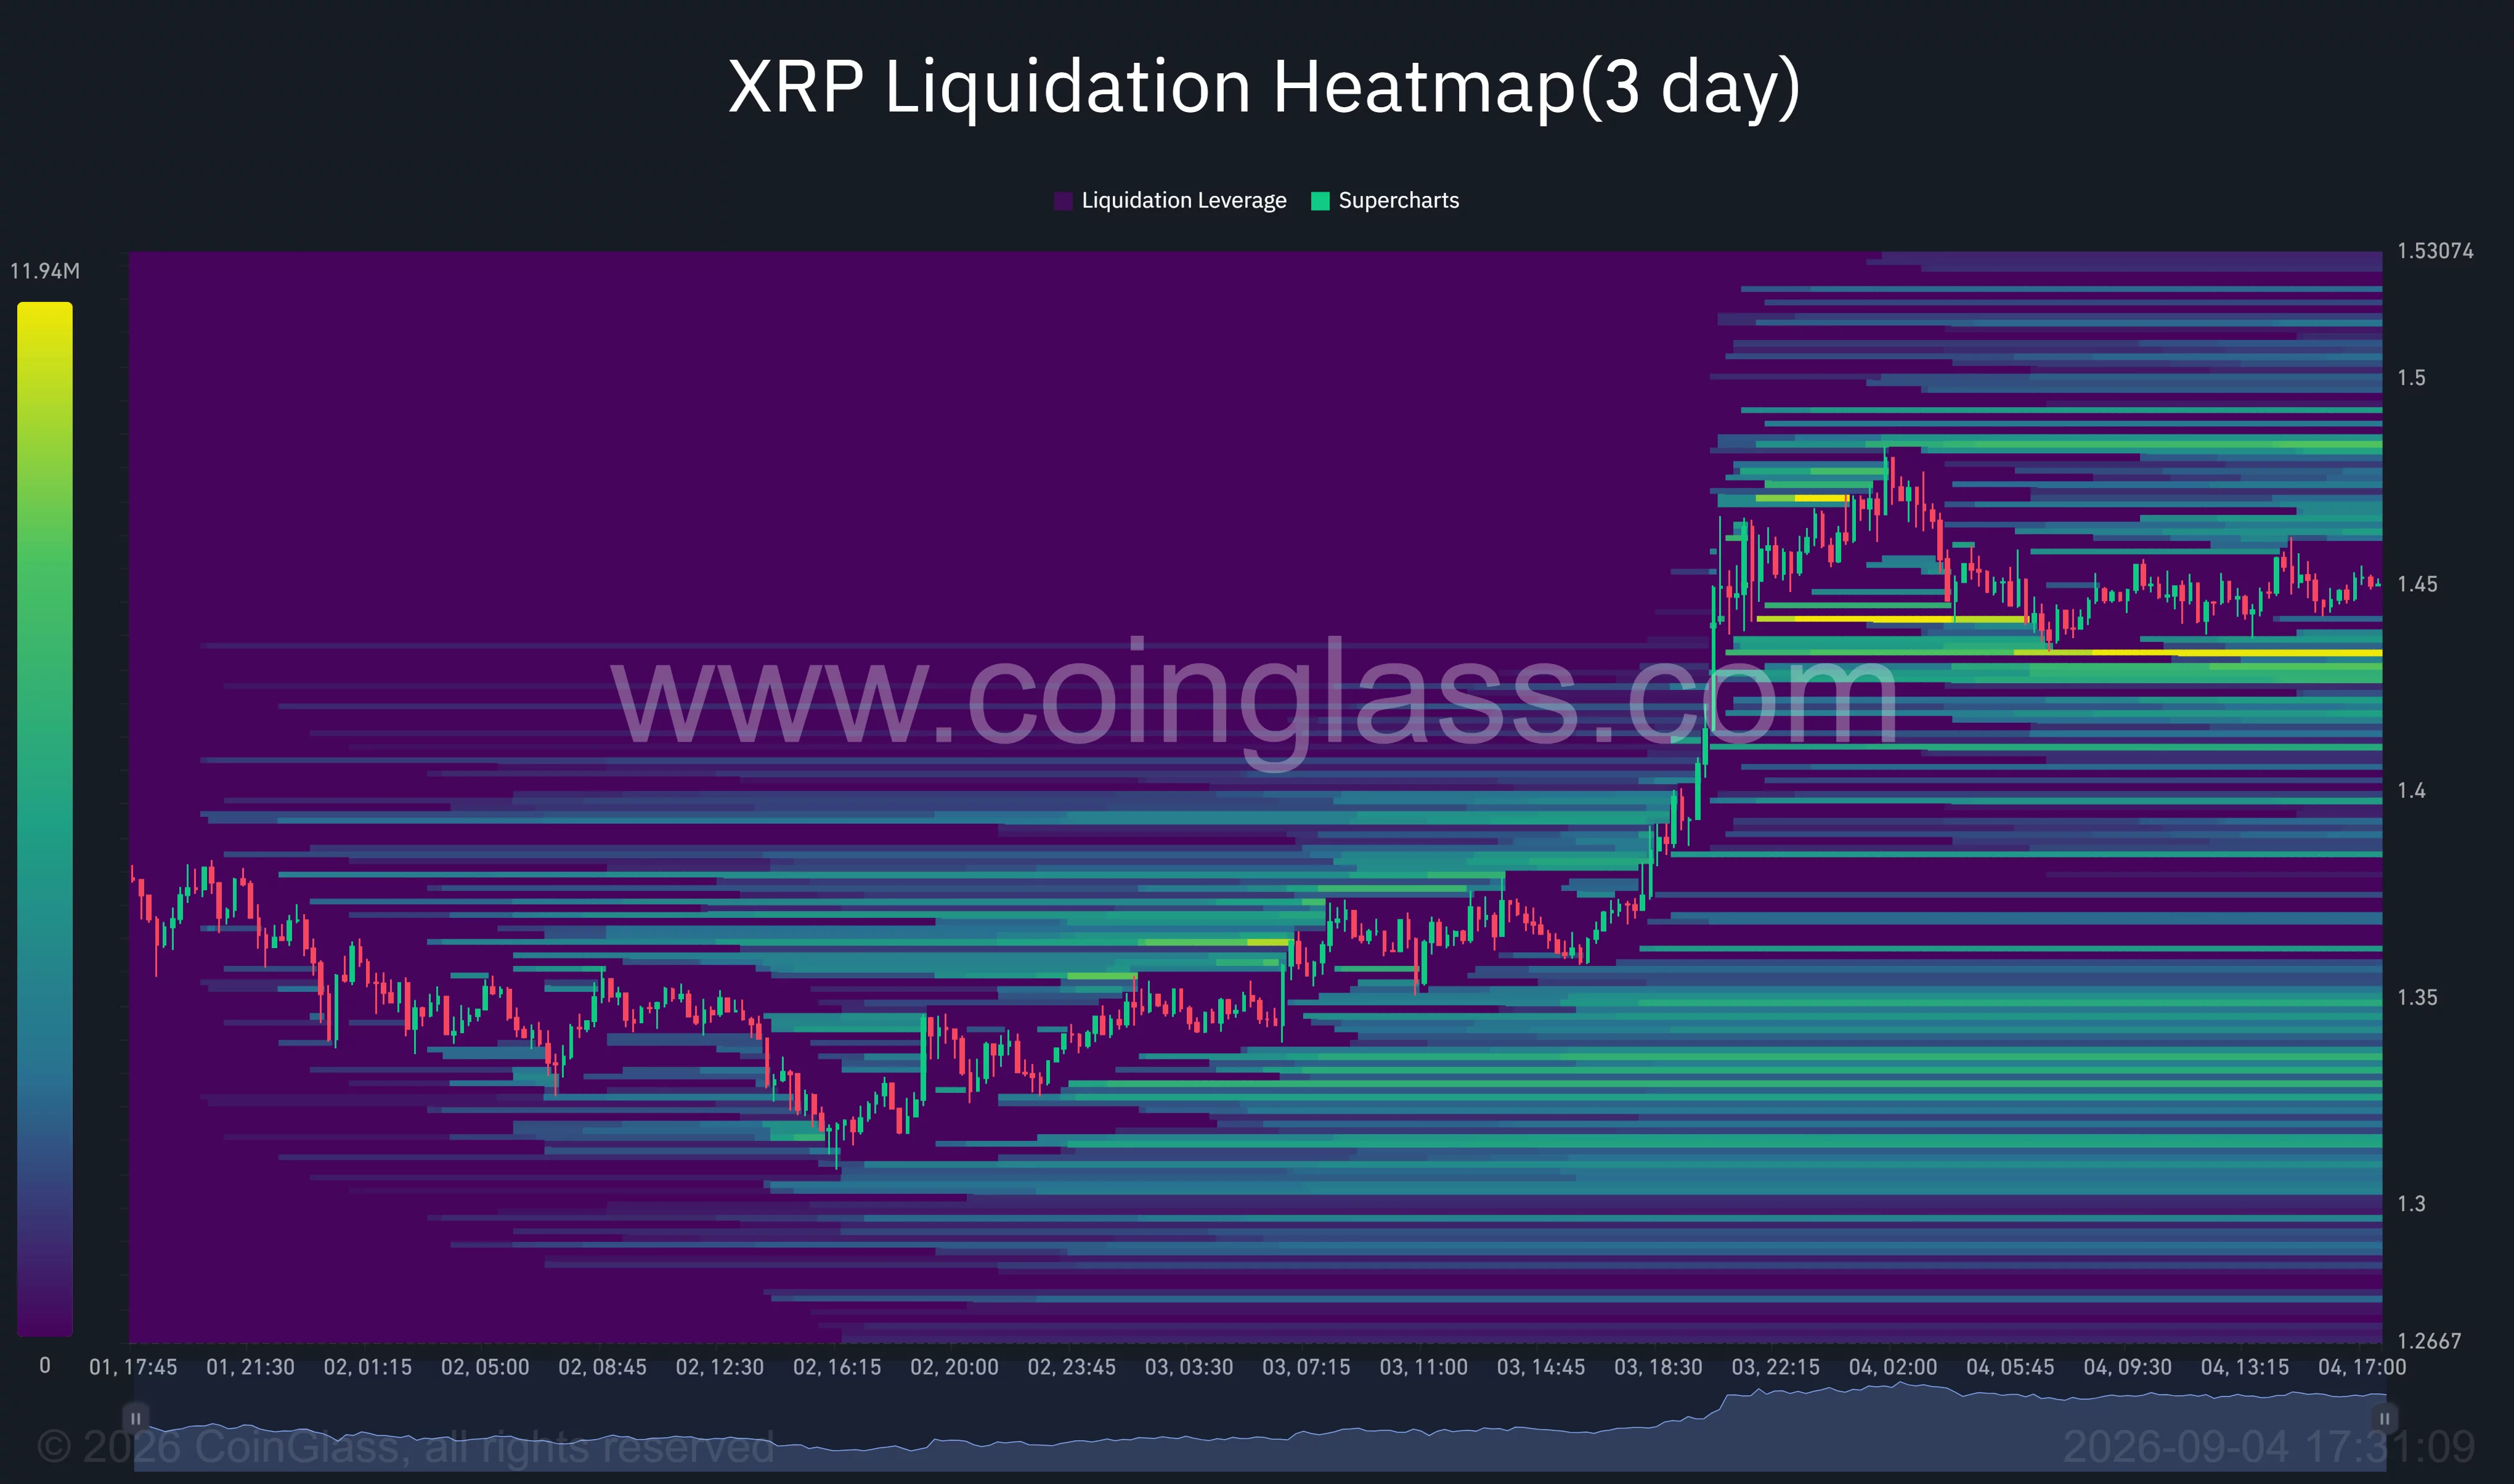
Further downside liquidity is spread across $1.40 and $1.37. The latter level is especially important because it overlaps with the former 4-hour channel resistance. A retest that holds above $1.37 would preserve the breakout structure.
A move below $1.37, however, would place the lower end of the former channel near $1.30 back in play. The daily Supertrend provides a wider structural support level at $1.2439, close to ChartNerd’s 20-week EMA near $1.28.
Above the market, liquidation positions are concentrated from approximately $1.48 to $1.53. A break into that zone could force short sellers to close their positions, adding market buy orders and potentially accelerating the move.
The heatmap does not guarantee that the price will reach either pool. It instead identifies areas where leveraged positions may be vulnerable if volatility increases.
Analysts see higher targets if the breakout holds
A separate analysis published by trader CW said XRP’s previous correction ended near the 0.5 Fibonacci retracement level. The token has since recovered above the 0.618 retracement, according to the analyst’s chart.
CW placed the next extended target at approximately $2.135, corresponding to the 1.618 Fibonacci extension. Reaching it would require XRP to clear several nearer barriers, including $1.50, $1.53, the August high near $1.70, and ChartNerd’s $1.80 target.
The nearer levels carry more importance for the current setup. A sustained move above $1.53 would complete the next stage of the breakout, while rejection could keep XRP confined between roughly $1.37 and $1.50.
US catalysts could raise XRP volatility
US-listed spot XRP exchange-traded funds recorded $110.49 million in net inflows during the week ending Aug. 28, their strongest weekly result of 2026. The figure followed an earlier increase in XRP ETF activity, with cumulative inflows reaching approximately $1.6 billion.
Traders are also watching the Senate’s Sept. 15 procedural vote on the CLARITY Act. The cloture motion requires 60 votes to advance and would end debate on the motion to proceed rather than pass the bill itself. The legislation could affect how US regulators divide oversight of digital assets.
Federal Reserve policy represents another near-term risk. Fed Governor Christopher Waller said on Sept. 3 that three-month core inflation had fallen from 4.76% in February to 3.05% through July.
Waller said he would support leaving rates unchanged if incoming inflation data confirms the cooling trend, but he did not rule out a hike if price pressures return. The August inflation report and the Fed’s Sept. 15–16 meeting could therefore influence liquidity across XRP and the wider crypto market.
For now, XRP’s 4-hour breakout favors buyers above $1.37. A close over $1.53 would strengthen the case for $1.70 and $1.80, while a loss of $1.37 would expose the $1.30–$1.24 support region.
Disclosure: This article does not represent investment advice. The content and materials featured on this page are for educational purposes only.


Be the first to comment