


What to know:
- XRP is trading near $1.37 in a tight range between $1.29 and $1.50, signaling a possible breakout.
- A Bollinger Band squeeze on the 3-day chart shows volatility compression, often before a big move.
- Despite market weakness, XRP saw about $750K ETF inflows, while Bitcoin and Ethereum saw outflows.

XRP price is moving in a narrow consolidation range, signaling a potential sharp breakout. A move above resistance could trigger upside, while the loss of support risks a decline. Despite market weakness, XRP saw small ETF inflows while Bitcoin and Ethereum faced outflows.
At the time of writing, XRP is trading at $1.37 with a 24-hour trading volume of $1.83 billion and a market capitalization of $85.01 billion. Despite the signs of stability over the last 24 hours, XRP’s movement in a narrow range and positive ETF flow point to a trend reversal.


Source: CoinMarketCap

Also Read: XRP ETFs Record $60M Weekly Inflows, Highest in 2026
XRP Price Coils for Breakout Toward $1.50
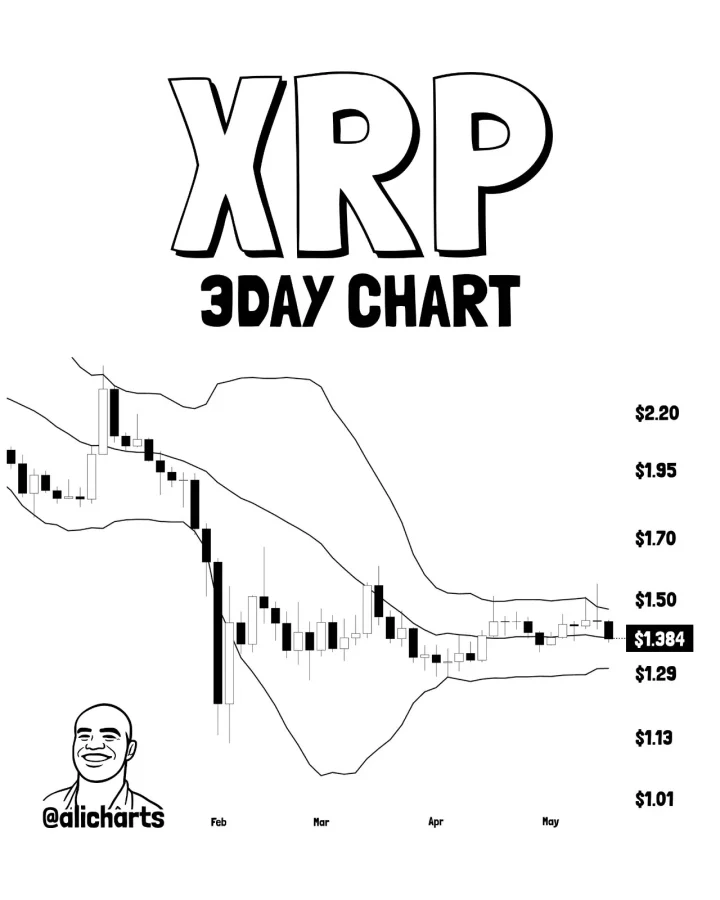
According to the crypto analyst Ali Charts, the XRP price is approaching a major technical inflection point as its 3-day chart shows one of the tightest Bollinger Band squeezes in over a year.
Market volatility has compressed significantly, suggesting an imminent expansion phase. Traders are watching closely as the XRP price coils within a defined consolidation range, awaiting a decisive breakout signal to emerge soon.
The XRP price action is squeezed inside a tight channel oscillating between $1.29 and $1.50. The neutrality of the compression makes the trend direction ambiguous.
A clear breakdown of the resistance level on three consecutive days will create opportunities for a bullish breakout towards $1.80. On the other hand, falling below support will weaken the present scenario and favor bearish moves, aiming at $1.
Source: Ali Charts’ X Post
However, the current situation with the Bollinger Bands shows that there is a very tight squeeze of volatility, which means that a strong move in the XRP price may happen at any time.
However, it still remains a non-trading territory until a certain signal confirms that the breakout actually happened. One should wait until the candle closes in three days to confirm the breakout for the XRP price.
XRP Defies Crypto Crash With Positive ETF Inflows
The data from BankXRP further highlighted that while the rest of the crypto ETFs’ day is largely red, XRP managed to make an uncommonly positive flow divergence.
The Bitcoin ETFs declined by around $648 million, while Ethereum lost close to $86 million. XRP, on the other hand, attracted around $750K worth of inflows.


Source: BankXRP’s X Post
ETF flows usually act as a market mood ring, and thus, this divergence in flow becomes very conspicuous.
The weakness of BTC and ETH suggests that there is a risk-off sentiment in the market, but the inflows into XRP indicate that there may be some selective buying. Even though the figures are small, this difference is making traders watch the charts closely.
This article contains market analysis and price predictions. These are not guarantees. Crypto markets are volatile. Always DYOR. Not financial advice.
Also Read: XRP Price Analysis: Will a Breakout Above $1.50 Trigger a Rally?

Be the first to comment