



XRP price is getting stronger on the back of improved technicals, with some experts expecting a possible breakout towards higher levels. The major resistance level at $1.55 could be important to watch for any further upside, as the momentum is deteriorating.
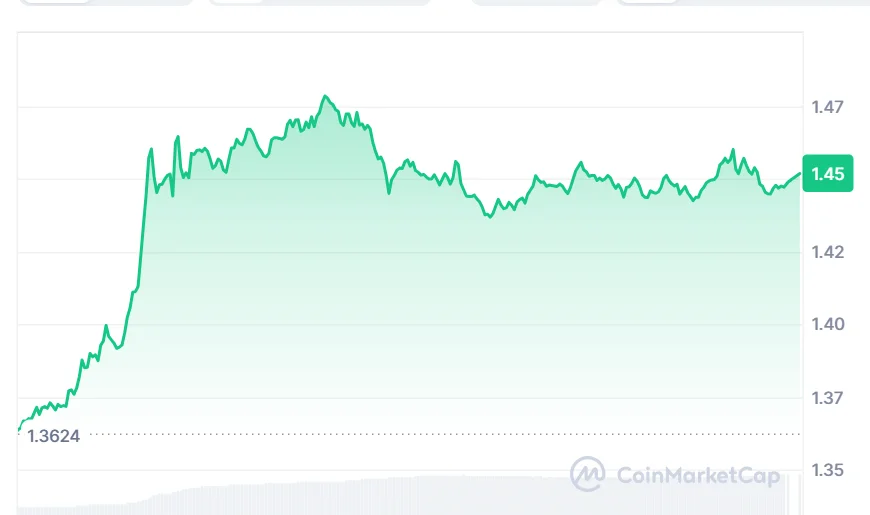
At the time of writing, XRP is trading at $1.45, with a 24-hour trading volume of $6.21 billion and a market capitalization of approximately $90.89 billion. The token has gained 6.12% over the last 24 hours, according to the figures provided.
XRP Price Setup Turns Bullish as Breakout Nears
Crypto analyst Crypto Patel, on September 4, 2026, mentioned the bullish structure seen in XRP, noting that the crypto managed to stay above its vital accumulation zone even though the higher time frame structure was improving.
The $1.55 level is seen as the significant level here. A breakout above this level will give way for XRP price to head towards $3.20, and much higher levels towards $10 could be possible in case of supportive higher time frame structure.

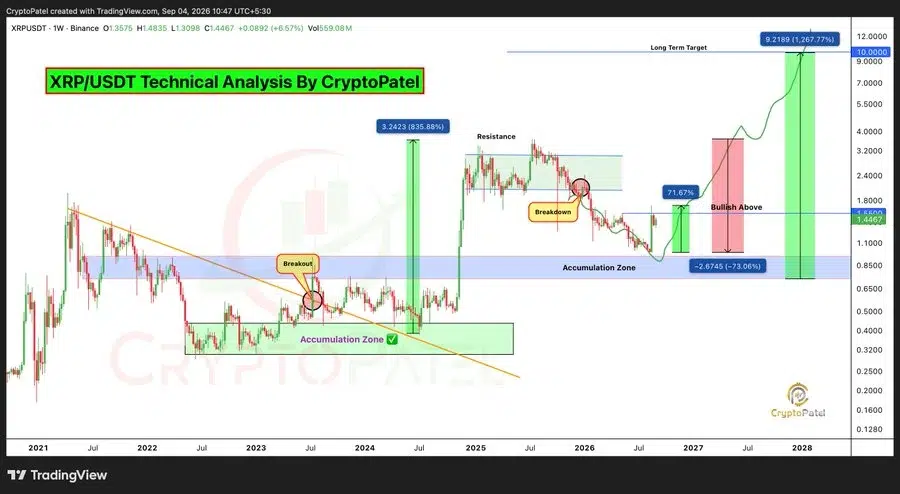
It does not necessarily imply that XRP will definitely hit the price point of $10. It only describes a probable path that will see the crossing of multiple resistance points on the road there.
An upward move from the price level of $1.45 to $10 would mean an increment of about 590%, which would make the target level very hard to attain.
Also Read | Polymarket Perpetual Trading Launches With 20x Leverage for International Users
Fibonacci Levels Point to $2.13 Target
Another technical analyst, CW, suggested a nearer-term price objective for XRP. According to CW, XRP price had experienced a corrective period after its previous rally, which ended near the 0.5 Fibonacci Retracement level. In the meantime, XRP has recovered and is now trading above the 0.618 Fibonacci level.
Based on this pattern, CW determined that the next potential upside target would be around $2.135, which is the level of the 1.618 Fibonacci extension.
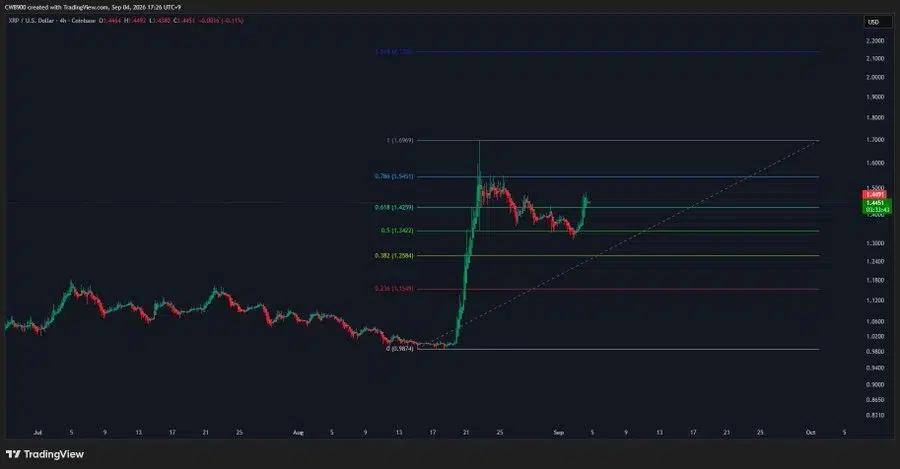
This level is much closer compared to the level of $10 and hence could be considered an intermediate goal for XRP price.
XRP Technical Indicators Show Mixed Signals
Ripple is currently trading above the middle Bollinger Bands level at $1.33573, thus maintaining an overall positive outlook for XRP price.
The upper band is at $1.66741, whereas the lower one is at $1.00404, meaning that there is a wide trading band. However, Ripple is still below the upper Bollinger Band, thus suggesting that resistance will appear around $1.67.
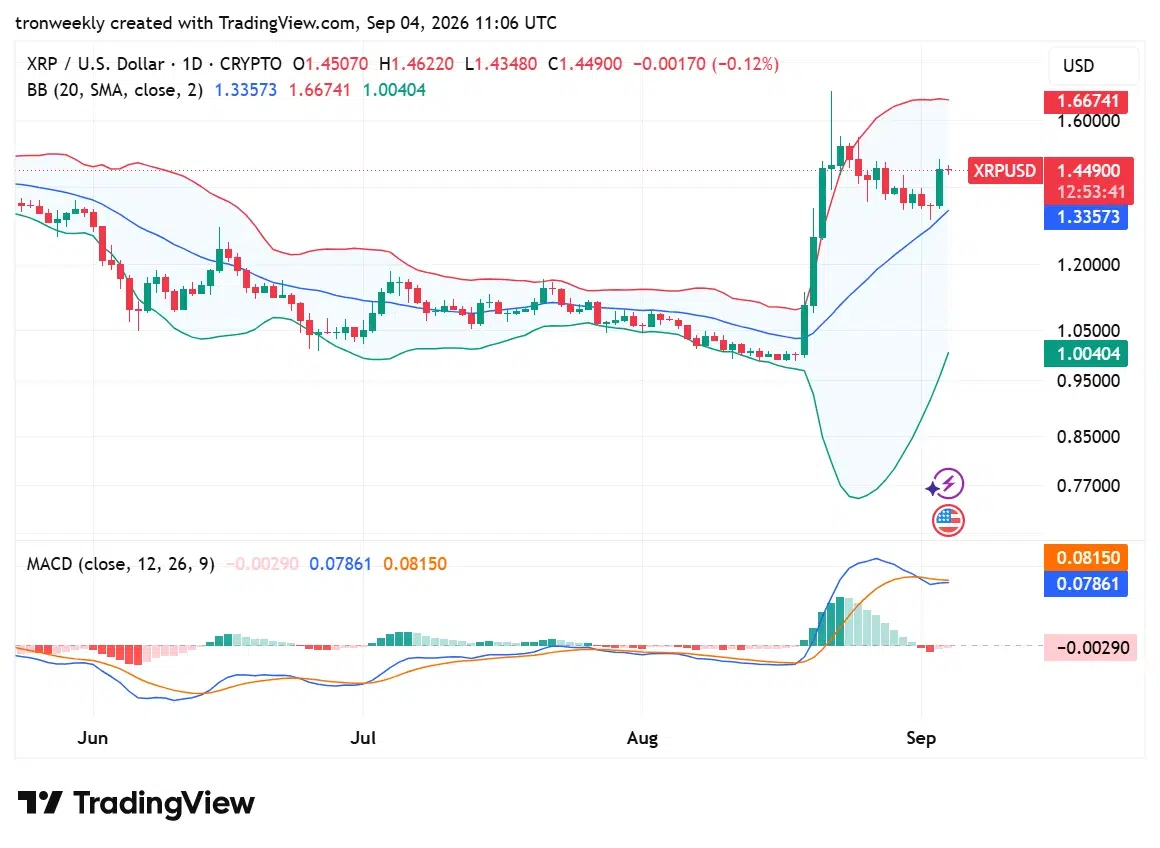
The MACD line is at 0.07861 and is currently below the signal line at 0.08150. As a result, bullish strength is getting weaker. The histogram is at -0.00290. Should this negative pressure continue, Ripple is expected to undergo a downward reversal.
What Happens Next for XRP Price?
The level of $1.55 is bound to be among the key short-term price levels, as its sustained move above it might boost the bullish pattern marked out by Crypto Patel and possibly make the $1.67 resistance level its target.
Should the cryptocurrency move up and clear that level, then the subsequent phases of the pattern could lead it towards the $2.13 Fibonacci extension level. Further on, the $3.20 level would come into play, but before that, a much more realistic $10 target could come under discussion.
But the negative MACD reading signals that there are still momentum risks for XRP. If the cryptocurrency fails to break above the level of $1.33 on the middle Bollinger Band, then it will reduce the strength of the current setup and increase the likelihood of a deeper pullback.
For the XRP bulls, it should be noted that the technical setup has strengthened, but there is no confirmation yet. It will become clear only after the breakout of the levels of $1.55 and $1.67.
Also Read | Coinbase Targets US Stock Perpetuals With 2 SEC Filings
This article contains market analysis and price predictions. These are not guarantees. Crypto markets are volatile. Always DYOR. Not financial advice.



Be the first to comment