



XRP price is exhibiting a lot of bullishness in terms of its potential to perform in the long run due to the existence of a significant technical setup that could break above the resistance.
At the time of writing, XRP is trading at around $1.40, down 3.05% over the last 24 hours. The cryptocurrency has a daily trading volume of approximately $3.47 billion, while its market capitalization stands near $88.11 billion.
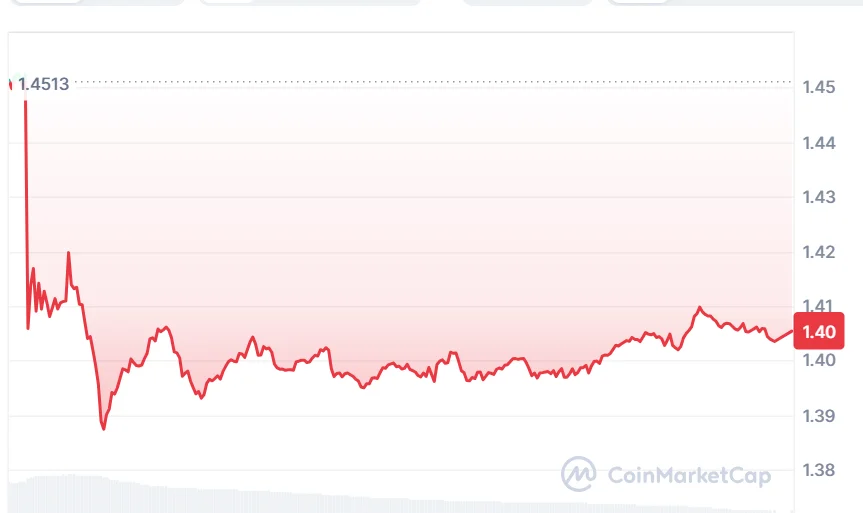
XRP Price Signals Bullish Breakout
In spite of the short-term drop, the bigger technical situation continues to be an important issue for the XRP market. On September 5, 2026, crypto analyst Ali Martinez pointed out a bullish scenario in the long term, when XRP will be able to touch $60 in case of a successful monthly chart breakout.
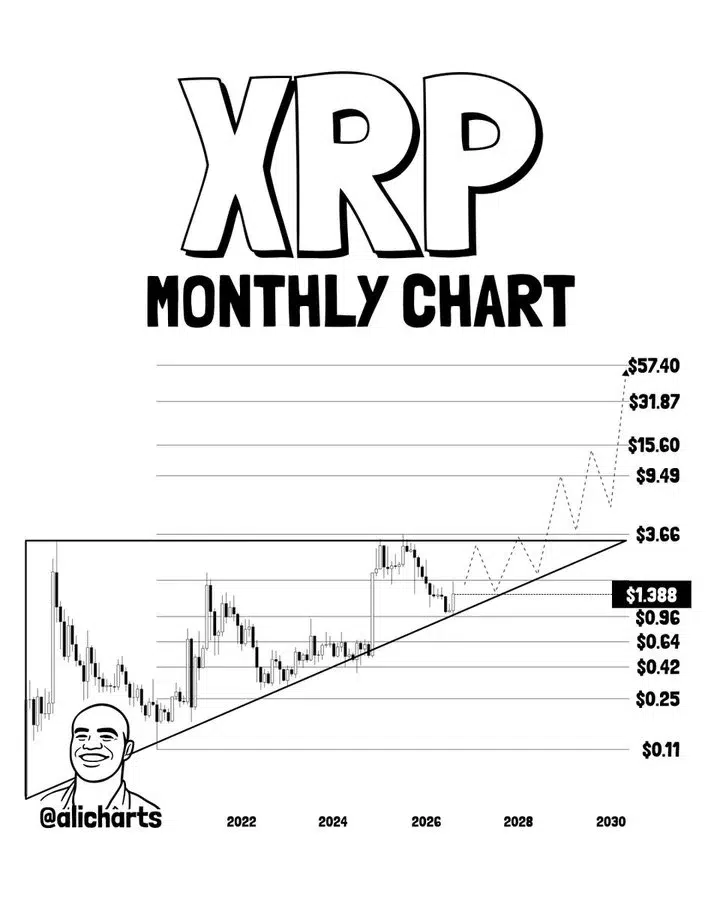
It is reported that XRP has been forming a big ascending triangle on its monthly chart for nearly ten years already. It is an important pattern to consider since it is capable of changing the course of the price movement once broken.

Also Read | XRP Price Breaks Resistance as Buyers Target $2 Recovery Milestone
XRP Price Faces Key Resistance
A consistent breakout above the level of $3.66 per month would be a critical technical event for XRP. In the opinion of Martinez, such a technical event would indicate that the ascending triangle pattern was completed and would clear the path to the long-term technical target near the level of $60.
This level is very high compared to the current price of the coin, which means that the forecast indicates a rally of several thousand percent. But we should distinguish between the chart target and the final price. For the completion of the technical target, the XRP price would have to break through several resistance levels.
It is clear that this level is more significant now compared to the $60 target itself. The breakout above it would cause some interest towards the asset, while further rejections will likely hold it within its current range.
XRP Momentum Shows Mixed Signals
The RSI (14) of XRP is trading at 60.53, which is above the neutral level of 50 and indicates that bulls retain a little dominance. Yet, it is below the RSI average of 67.58 and shows that momentum has been reduced after the recent increase. The overall sentiment is bullish but not very strong.

MACD line stands at 0.07139, which is below the signal line of 0.07884, while the histogram shows a negative value of -0.00745. It indicates that bullish momentum is deteriorating and a weak setup exists in the short term. Crossing above the signal line can strengthen the momentum of XRP.
What Happens Next for XRP Price?
The next important point is the ability of XRP to gain positive traction and break above the resistance at $3.66.
Before that, investors might be watching price behavior around relevant support and resistance areas, as well as fluctuations in trading volumes and momentum oscillators. An improvement in MACD readings and RSI values might improve the near-term outlook.
A monthly close above $3.66 would still be the key one. Once it happens, the ascending triangle pattern that Martinez predicted would break at around $60 would come into focus.
But until then, XRP is trading far from this key level. Its short-term direction will depend on whether bulls can gain the upper hand after the current pullback.
Also Read | ADA Price Eyes $10 as Momentum Returns and ChatterPay Expands Adoption
This article contains market analysis and price predictions. These are not guarantees. Crypto markets are volatile. Always DYOR. Not financial advice.



Be the first to comment