



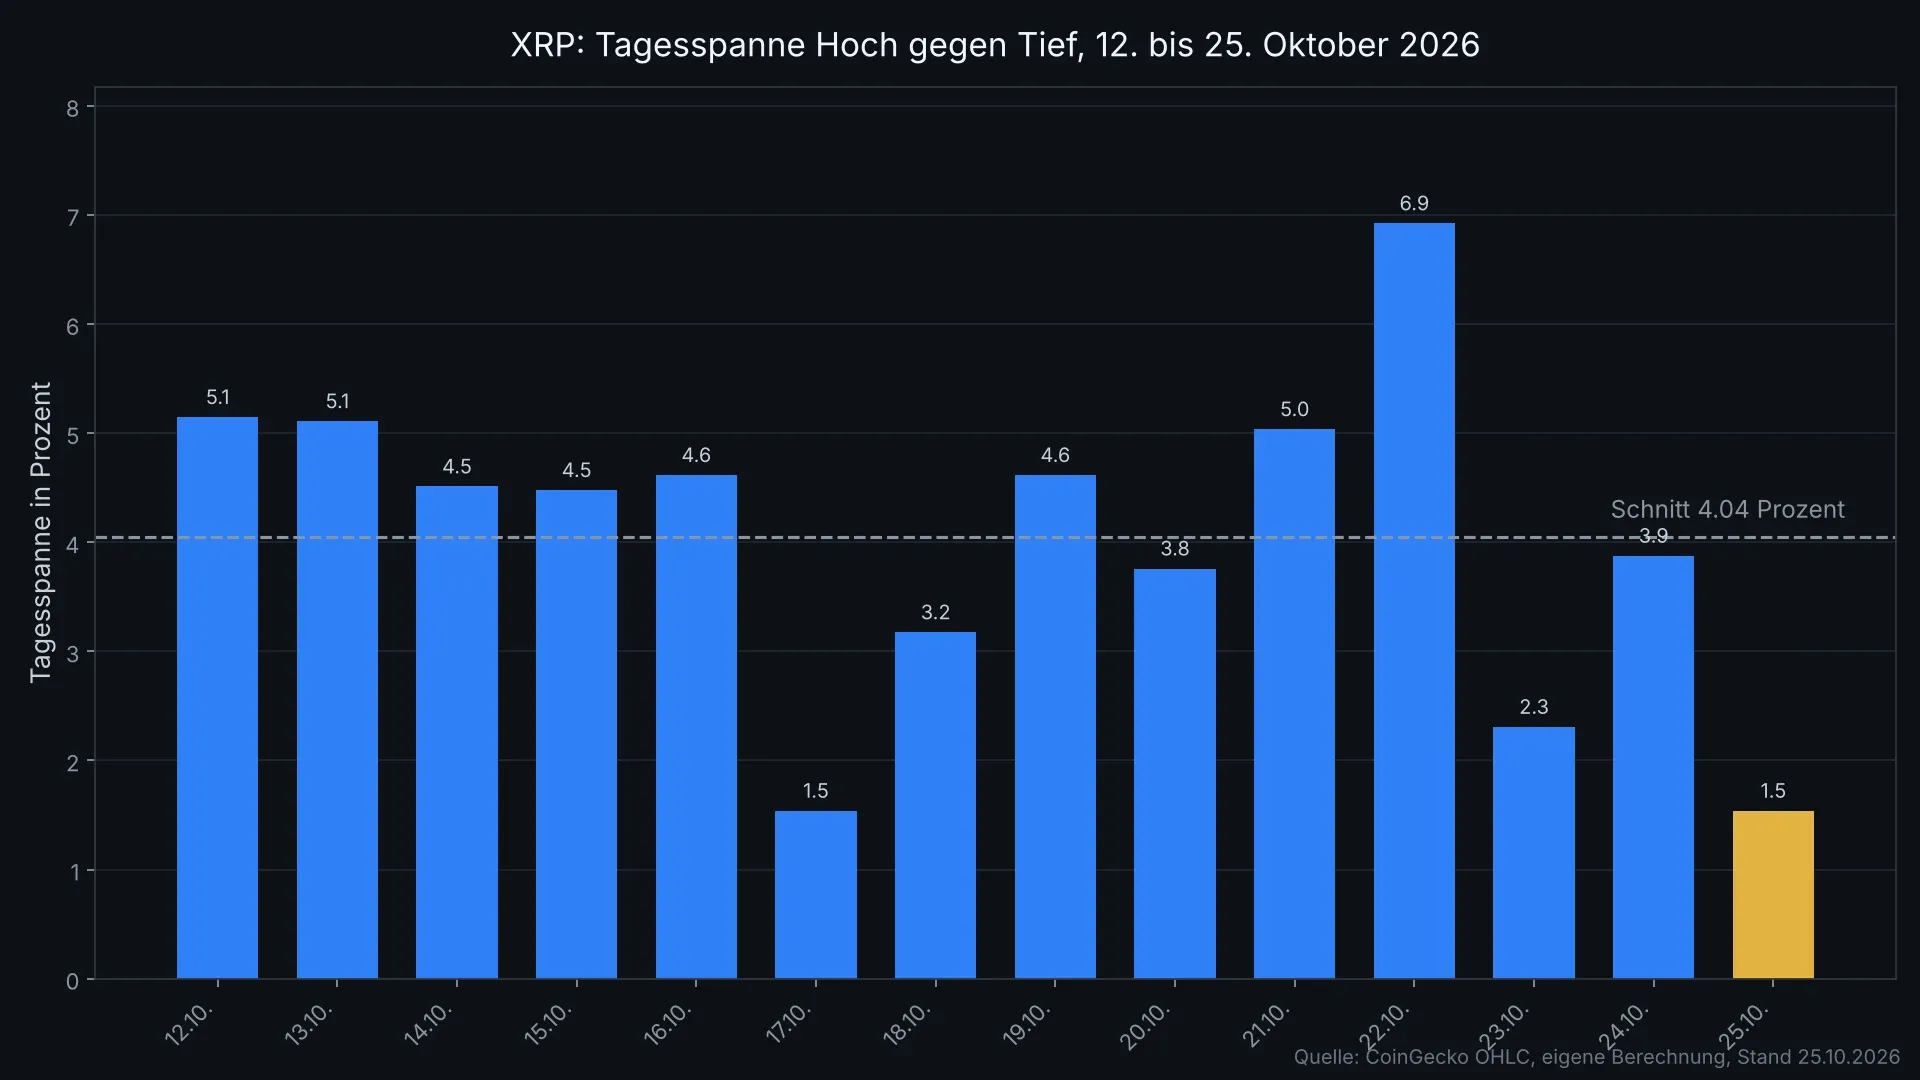
Here is what is documented: XRP stands at $1.30 on Sunday evening, with a daily high of $1.31 and a daily low of $1.29. Those two readings give a daily range of 1.54 percent, measured against the current price. Across the past 14 trading days that range averaged 4.04 percent. Our assessment follows further below: a range this tight says nothing about direction, it says something about the moment at which direction arises.
The price itself barely moved this Sunday, up 0.65 percent over 24 hours according to market data from CoinGecko, retrieved on the evening of October 25. What is interesting is not that figure but how little ground the price covered for it. Two cents separated the high from the low. Where the price can point on a horizon of months is set out in our XRP price prediction.
How tight this trading day really was
The daily range is the gap between the highest and the lowest price of a day, divided by the current price. The metric measures how much ground buyers and sellers covered in a day, regardless of where the day ends. A day can close at plus 0.1 percent and still have carried six percent of range, if the price first fell and then rose.
For October 25 that calculation gives 1.54 percent. We evaluated CoinGecko’s OHLC data for the past 14 days ourselves, reading the high, the low and the closing price for each calendar day. The result: only one other day in October was equally tight, October 17, also at 1.54 percent. The widest day was October 22 at 6.92 percent, four and a half times the ground covered.

Between those two extremes sits the average of 4.04 percent. Today’s reading is therefore 62 percent below the mean of the past two weeks. Looking only at closing prices shows none of this: October 23 ended at $1.308 and October 25 at $1.299, a difference of less than one percent. The path there was entirely different on the two days.
What a shrinking range says about the market
A tight range arises when buyers and sellers have settled on a price and neither side is willing to trade much above or below it. That typically happens for two reasons. First, when trading volume falls because fewer participants are in the market, at the weekend for instance. Second, when participants are waiting for information they do not yet have.
Both apply to this Sunday, and the second point is the more important one. On Wednesday, October 28, the US Federal Reserve announces its interest rate decision. Anyone building a larger position today has to survive that decision. Many are therefore standing back, and the waiting itself produces the tightness in the chart.
That reading has a consequence reaching beyond XRP. The whole market stood still on this Sunday: Bitcoin moved 0.02 percent lower, Ethereum 0.19 percent higher, Solana 0.27 percent, Dogecoin 0.11 percent lower. XRP, at plus 0.65 percent, was the strongest of those five, and even that is barely more than noise. A market phase in which all the large assets stand still at once is as a rule not a phase of decision but the phase before one.
Wednesday’s rate decision and its route into the price
The Fed’s Open Market Committee meets on October 27 and 28, with the decision coming on Wednesday at 2 p.m. local time in Washington, so 7 p.m. German time. The date is in the Federal Reserve’s official meeting calendar. Half an hour later the press conference begins, and experience shows that the framing spoken there often moves markets more than the rate step itself.
The route from a rate decision to a crypto price runs through two stations. The first is the dollar: a higher rate makes dollar assets more attractive, the dollar rises, and everything quoted in dollars faces a headwind. The second station is the risk appetite of institutional investors. If the rate falls, assets without a running yield are easier to justify, and crypto belongs to that group.
For XRP a third point comes in that sets it apart from Bitcoin. A considerable share of XRP trades through futures contracts. We measured on October 24 that open leverage stood at 4.8 percent of market capitalisation, as set out in our analysis of the leverage load of October 24. Those positions have an expiry date and a funding rate that accrues continuously. Anyone positioned with leverage cannot sit out a quiet market indefinitely.
What has changed since the measurement of October 24
On October 24 XRP closed at $1.2938. Today the price stands at $1.2986, a gain of 0.37 percent in two days. The leverage load of 4.8 percent of market capitalisation measured then was the lowest reading we have seen in October, and the price has practically not moved since. Today’s tightness is therefore not an isolated observation but the continuation of a state that has held for two days.
A different figure has shifted: the distance to the monthly low. On October 18 XRP fell to $1.2927, the lowest closing price of the month. Today the price sits 0.46 percent above it. That distance was still 5.6 percent on October 22, after the price had risen to $1.3651. This week’s recovery has been given back entirely since, without a single day carrying a large loss.
The levels at which the tightness breaks
Three levels follow from the data of the past two weeks that are evidenced rather than estimated.
On the downside the first is $1.2927, the closing price of October 18 and the monthly low. Break below it and the next documented step is $1.26, the lowest point the intraday data shows on October 18 and 19. Between those two readings lie 2.5 percent, and the market turned twice in that area in October.
On the upside the first hurdle is $1.31, today’s daily high. Above it sits $1.3651, the closing price of October 22 and thus the interim high of the past week. The third level is $1.40, the daily high of October 21 and the last price at which XRP traded more than four percent above today’s level.
For the month as a whole a clear picture emerges. On October 1 XRP stood at $1.4896. By today that has become $1.2986, a loss of 12.8 percent in 25 days. From the monthly high of $1.5197 on October 5 the price is 14.6 percent away, and from the all-time high of $3.65 it is 64.4 percent away. Market capitalisation stands at $82.3 billion.
Why leveraged positions are more dangerous in tight ranges
This point is regularly misunderstood, so here is the mechanism in three sentences. Holding a position with leverage means depositing only part of the value as collateral and being closed out by force as soon as the price eats through that collateral. The tighter the market trades, the closer traders set their stops to the current price, because the swing appears small. When the tightness then resolves in one direction, many of those stops trigger at the same time, and the forced sales amplify the move that set them off.
For investors that means today’s calm is not an argument for more leverage but the opposite. Whoever holds a leveraged position before Wednesday should know at which price it gets liquidated, and whether that price sits above or below $1.26. Fees and funding rates differ considerably between venues, as a look at our comparison of perp exchanges shows.

Two November dates already in the calendar
After Wednesday come two dates that concern XRP directly and do not depend on the market.
On November 1 the monthly release from Ripple’s escrow account runs. It holds tokens that are contractually bound and released in fixed tranches of one billion XRP each. Ripple usually locks most of that away again, so the amount actually arriving in circulation turns out far smaller than the headline suggests. What counts is how much goes back into escrow next time.
The second date is November 4. That is when the deadline ends for validators to approve a protocol change on the XRP Ledger that missed its cut-off on October 23. What is up for the vote there, and why the first deadline was missed, we wrote down in our report on the amendment delay.
Both dates fall within ten days. Together with Wednesday’s rate decision that makes three occasions in quick succession, and each of them has what it takes to end today’s range of 1.54 percent.
Our assessment of the situation
From the newsroom’s point of view the tight range is the most important signal of this weekend, and it cannot be read as a direction. In favour of that speaks the finding that all five large assets stand still at the same time: when Bitcoin, Ethereum, Solana, XRP and Dogecoin all stay under one percent of change on the same day, the cause does not lie with a single project but with Wednesday’s date. Against it speaks the fact that a compression of the range is no reliable omen for the direction of the breakout, only for its likelihood. The tightness is documented, its outcome is not.
What we draw from it: the $1.2927 of October 18 is the level at which it is decided after Wednesday whether October ends on a new monthly low. The distance to it today is less than half a percentage point. On the upside XRP would need 5.1 percent to win back the interim high of October 22. The asymmetry of those two distances is the real information of the day, and it is not a buy recommendation in either direction.
What investors in Germany can do at this point
Three things can be checked independently of the Fed, and all three are easier to settle on a quiet Sunday than on Wednesday evening.
The first is the holding period. Whoever holds XRP in their own possession for more than a year sells the gain tax-free as things currently stand, and at a price 64 percent below the all-time high the question of whether a position has already reached the one-year mark is more than a formality. The current state of the rules, including the ongoing reform debate, we track under crypto holding period.
The second is custody. XRP on an exchange belongs legally to the exchange, not to you, as long as you have not withdrawn it. Before a date that can trigger forced sales, the difference between self-custody and an exchange account is not a theoretical question.
The third is fees. At a price of $1.30 and a position of a few hundred euros, the spread at the venue often decides more about the outcome than a week of price movement. Which provider charges which costs is set out in our exchange comparison.
XRP before the Fed: below $1.2927 the tightness turns into a direction
The situation in three steps, each without a price forecast:
- Note the level. $1.2927 on the downside, $1.3651 on the upside. In between lies the area in which XRP has traded since October 23. Which venue gives you access to those levels at which cost is shown by the exchange comparison.
- Check your own leverage. Whoever is positioned with leverage needs the liquidation price in writing before 7 p.m. on Wednesday, not in their head. The funding rates of the venues are in the perp exchange comparison.
- Sort out the acquisition dates. For the holding period the day of purchase counts, not the calendar month. Whoever has several purchases needs a clean statement, and there are tax tools and portfolio trackers for that.
(As of October 25, 2026. This article is not investment advice. Prices and fee structures change; check the terms with the provider before you buy. Buying cryptocurrencies can lead to a total loss of the capital deployed.)



Be the first to comment