




TLDR
- XRP is trading at $1.09, up 0.99% in 24 hours, with a market cap of $68.46 billion
- Analyst Bird flagged a weekly MACD momentum reset on XRP Dominance charts — a pattern that preceded strong rallies twice before
- An inverse head-and-shoulders pattern is forming on the daily chart, with the neckline at $1.10–$1.12
- XRP is trading below its 20, 50, 100, and 200-day moving averages, confirming sellers remain in control
- RSI stands at 34.06, approaching oversold territory, suggesting downward momentum may be slowing
XRP is trading at $1.09, holding near a key demand zone as several technical patterns draw attention from analysts. The token is up 0.99% over the last 24 hours, with a 24-hour trading volume of $925.26 million and a market cap of $68.46 billion.
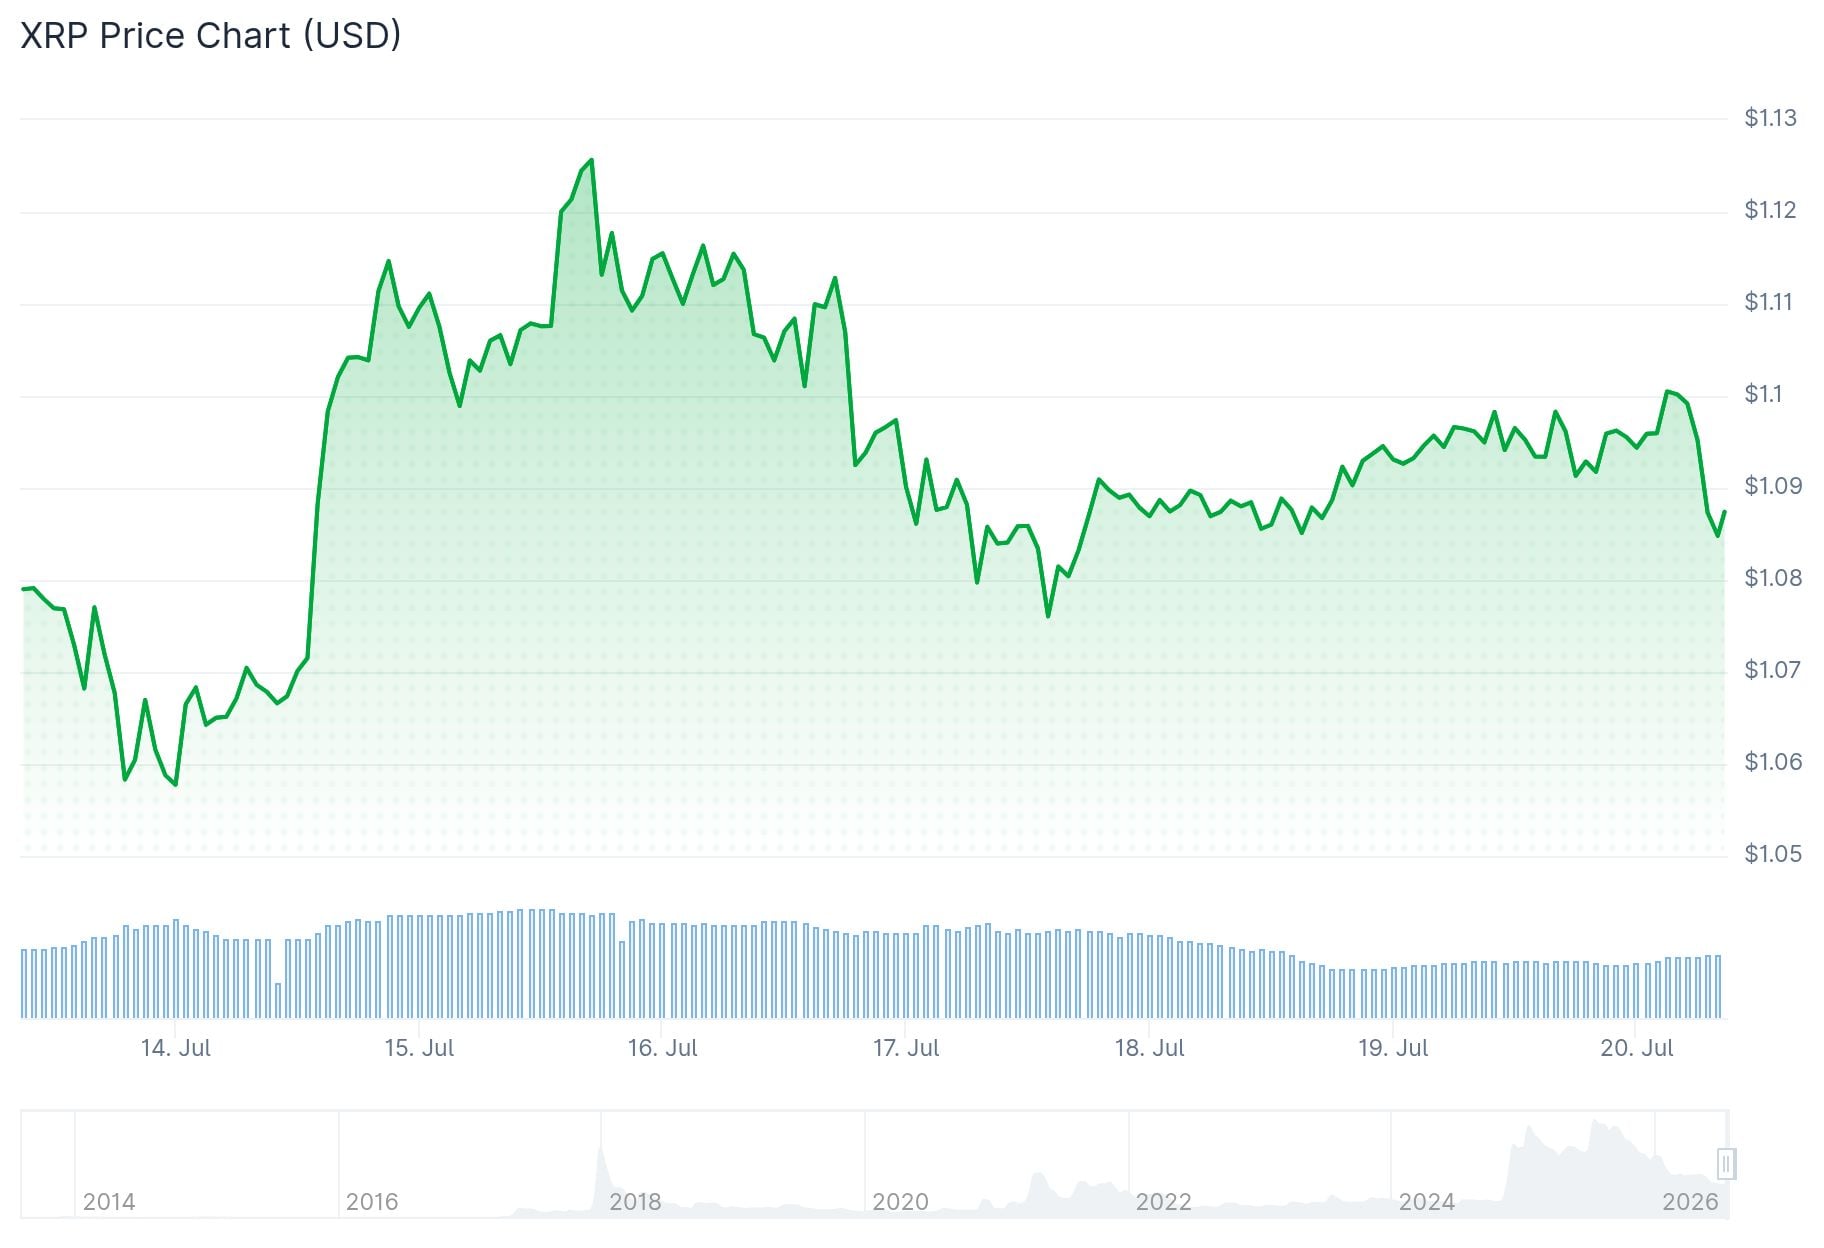
The price has spent much of 2026 in a downtrend after trading above $2 earlier in the year. Buyers have repeatedly attempted to stabilize the token, but resistance levels have continued to cap recovery attempts.
Crypto analyst Bird highlighted the XRP Dominance chart on July 19, 2026. This chart measures XRP’s share of the total crypto market rather than its price alone. Bird identified a weekly MACD momentum reset on this chart — a pattern he says has appeared twice before. On both previous occasions, XRP dominance rallied strongly after the reset.
One chart I’ve been watching very closely is XRP Dominance on the weekly timeframe.
The three blue lines all mark the point where the weekly MACD completes its reset.
The first two led to explosive moves in XRP Dominance.
Now we’re seeing the exact same setup after nearly a… pic.twitter.com/m0AEGRpOTB
— Bird (@Bird_XRPL) July 19, 2026
Bird noted that extended bearish trends tend to reset momentum oscillators, and that if buying interest returns, the resulting move could be sharp rather than gradual. He suggested this setup could be the beginning of a path toward a $27 price target, though he acknowledged the pattern does not guarantee that outcome.
Separately, analyst MikybullCrypto shared a post on X describing XRP as “the best low-risk play right now” with “at least 5x target,” reflecting growing interest from analysts tracking the token’s setup at current levels.
Inverse Head-and-Shoulders Pattern Forms
On the daily chart, a potential inverse head-and-shoulders pattern is developing. The head sits around $1.05–$1.07, with the neckline at $1.10–$1.12. This level is the key confirmation zone. A decisive close above $1.12 would strengthen the bullish case.

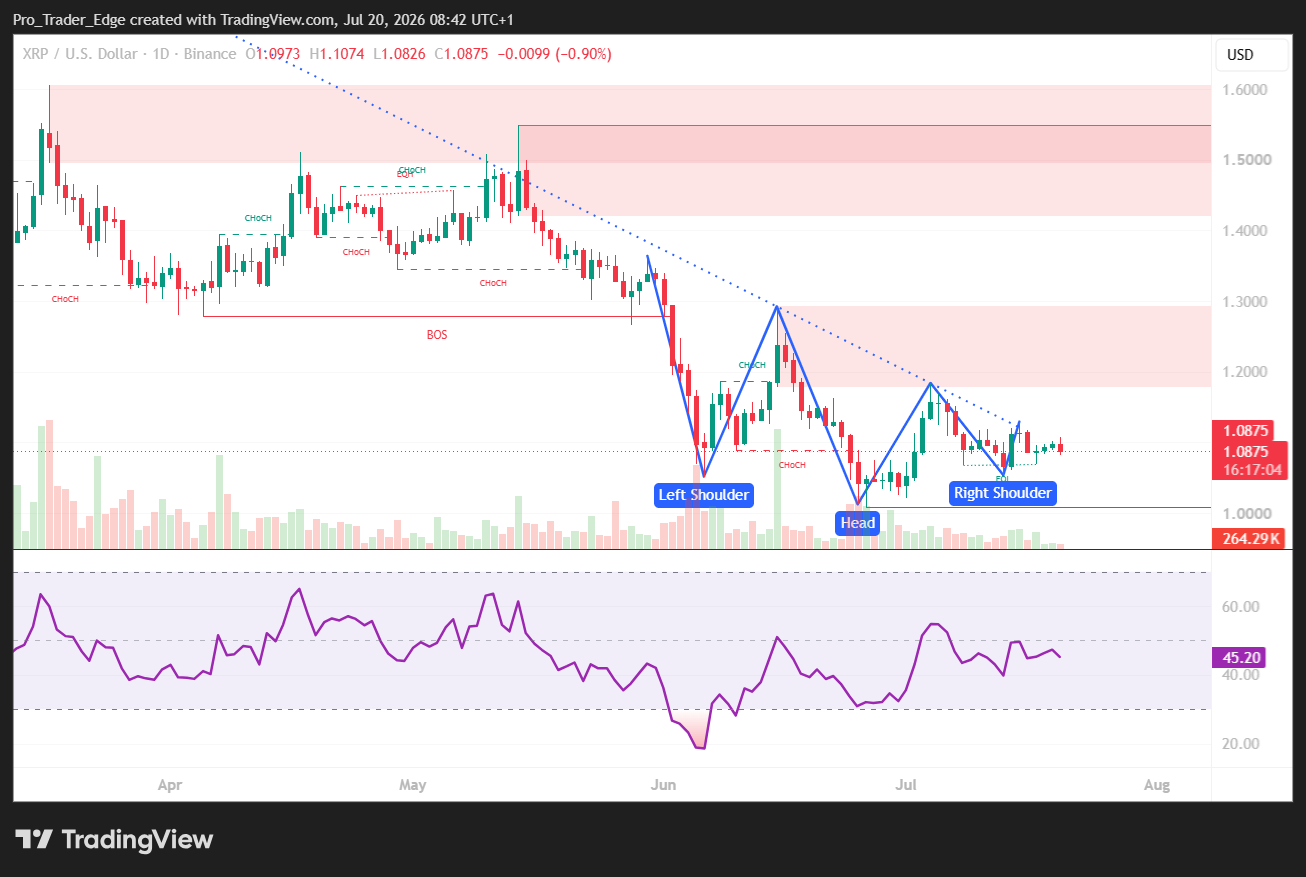
The same chart also shows XRP trading within a falling wedge. The two patterns overlap, creating a technical confluence. If XRP clears $1.12, the next resistance levels are $1.15 and $1.18–$1.20. Measured-move targets from a confirmed breakout point to $1.25–$1.35.
On the 4-hour chart, XRP recently faced rejection at $1.12–$1.13 and pulled back toward $1.06. Holding above $1.06 keeps the recovery structure intact.
Moving Averages Show Sellers Still in Control
XRP is trading below all major moving averages. The 20-day SMA is at $1.2885, the 50-day at $1.8896, the 100-day at $1.9167, and the 200-day at $1.2127. Each of these levels acts as resistance above the current price.
The 14-day RSI sits at 34.06, just above the oversold threshold of 30. The signal line is at 34.82. This indicates sellers have been dominant recently, but the pace of decline may be slowing.
The XRP/BTC ratio also approached a key SuperTrend retest level. The monthly SuperTrend flipped bullish in 2024 after years in a bearish phase. If that support holds, it could indicate XRP is beginning to regain relative strength against Bitcoin.
XRP was trading at $1.09 at press time, with the $1.10–$1.12 neckline remaining the key level to watch for any short-term directional move.



Be the first to comment