


Although XRP is still trading close to its lowest points from 2026, there is still a chance for a recovery. Despite the fact that the asset is still under a lot of technical pressure, a number of indicators point to the possibility that sellers are getting tired after months of almost constant weakness. Following yet another rejection from short-term resistance, the chart displays XRP trading at roughly $1.08.
The token has had difficulty creating any significant upward momentum since breaking below the crucial $1.28 support zone earlier this month. Each attempt at a rally has resulted in a lower high, demonstrating that bears continue to dominate the market structure. But it’s crucial to understand where XRP is right now.
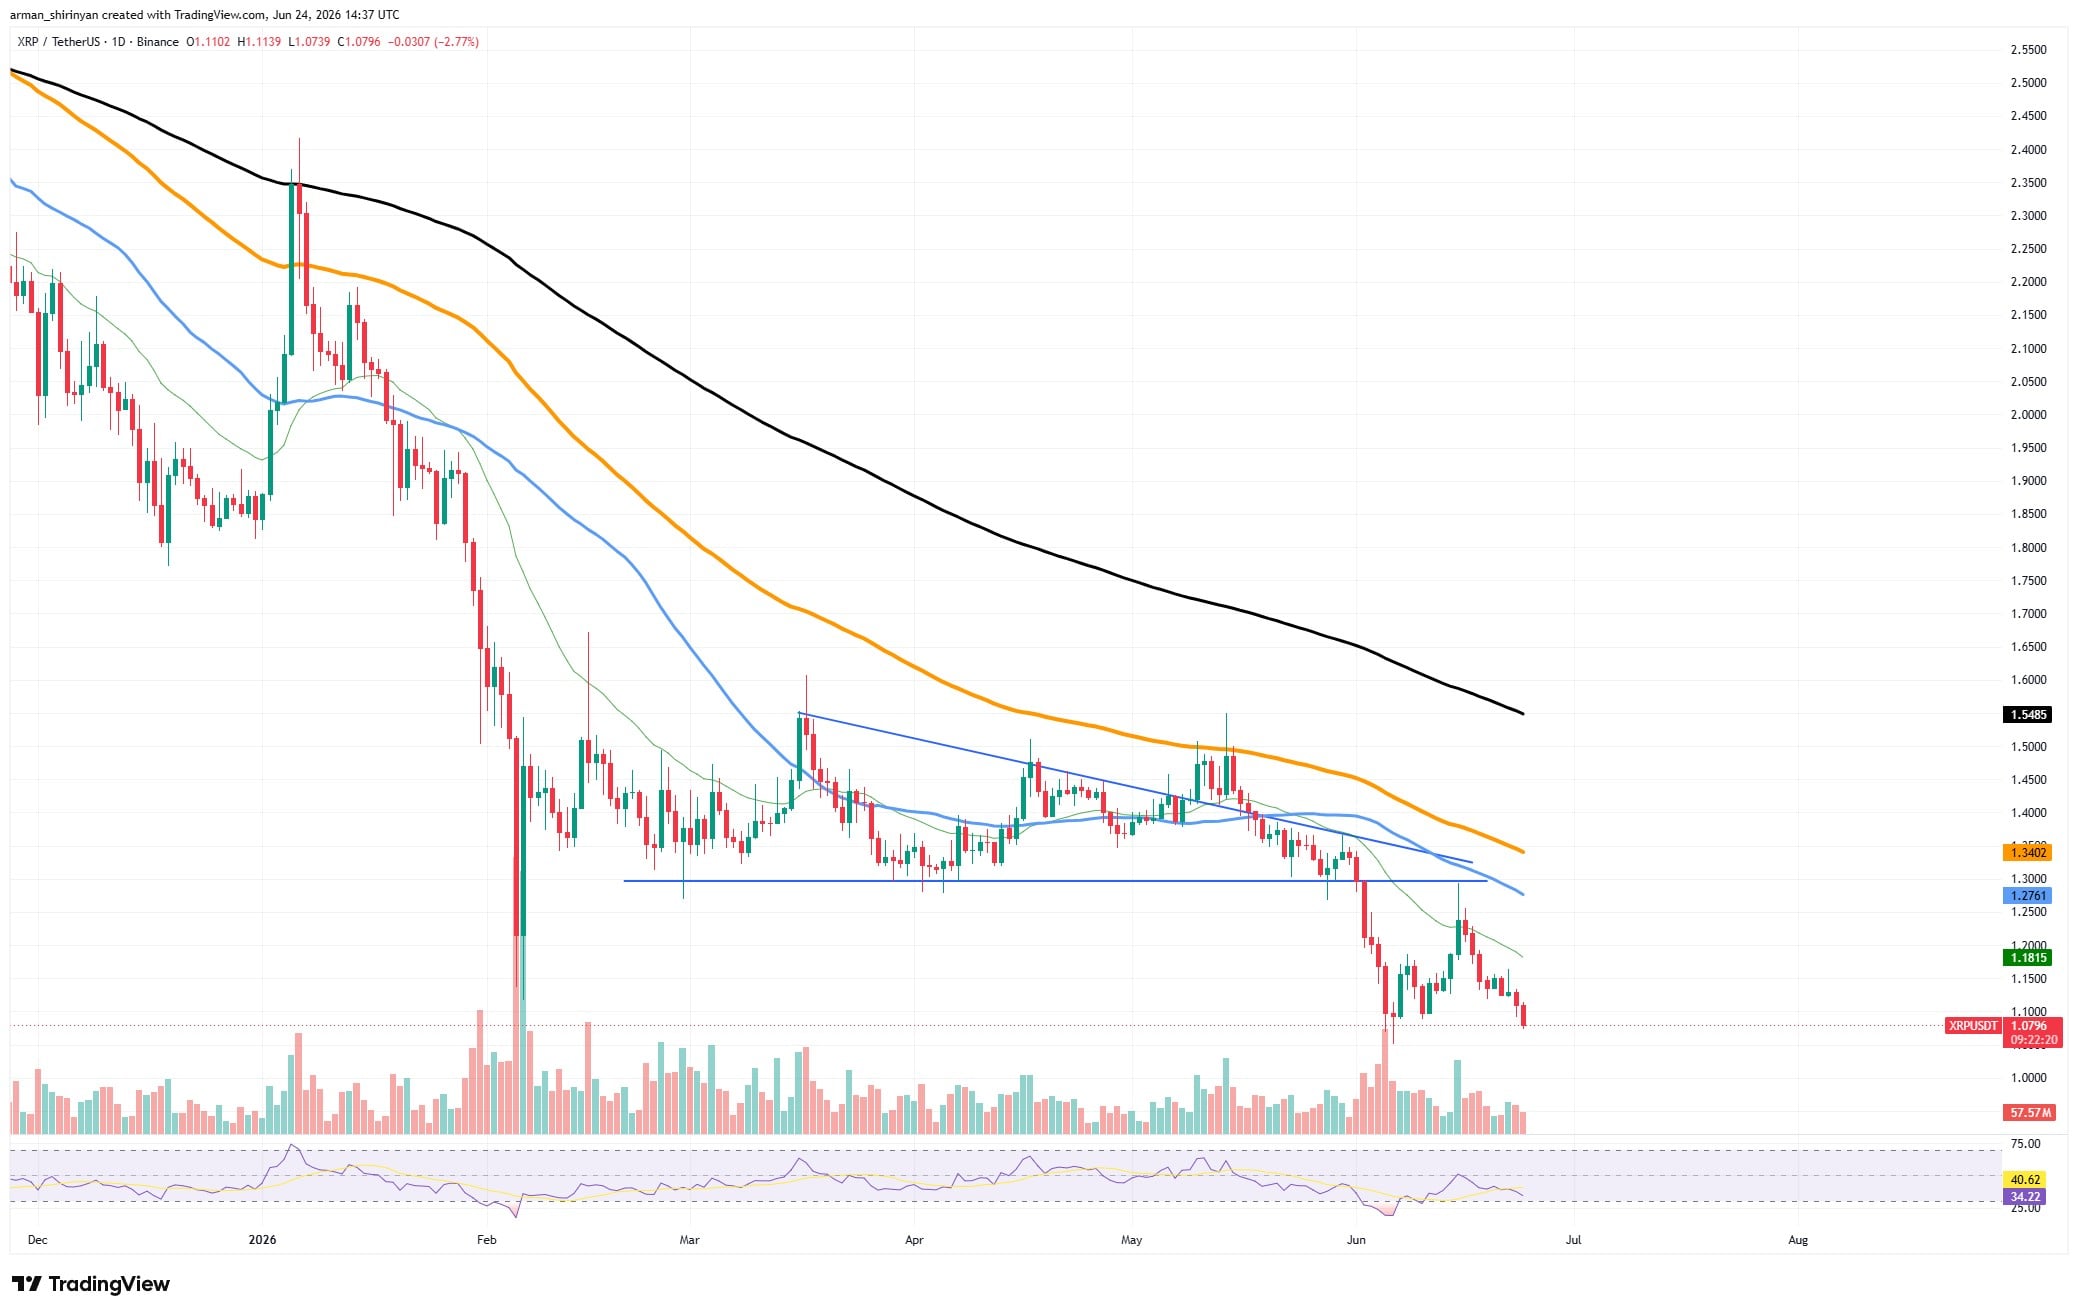
The same support area that prevented the February collapse and resulted in a significant rebound is being tested by the asset once more. This is one of the most significant price points XRP has seen this year because markets frequently return to key demand zones prior to more significant reversals.

Oversold conditions frequently signal that a large portion of the panic selling has already taken place, even though they do not by themselves ensure a reversal. In the past, XRP has produced some of its biggest comebacks during periods of extreme negativity. The bearish case is still simple. XRP continues to trade below its moving averages for the last 50, 100, and 200 days.
You Might Also Like

The longer-term moving averages are still sloping lower, and the former support zone around $1.28 has now turned into a significant resistance area. The overall trend is still negative until those levels are restored. However, markets seldom stay in a straight line for very long. The current setup is intriguing because of the increasing disparity between expectations and sentiment.
Since many traders now anticipate more declines, even a slight improvement in market conditions could lead to a relief rally that is stronger than anticipated. Attention may soon turn to a recovery of the wider range if buyers are able to push XRP back above $1.18 and defend the $1.05-$1.10 support zone.
XRP is currently still in a downward trend. However, the asset is currently trading at a level where recovery hopes are not wholly unrealistic, in contrast to earlier phases of the decline. The groundwork for a possible comeback is starting to take shape, but the bulls still have a long way to go.
Bitcoin’s breakthrough potential
Once more, Bitcoin is trying the patience of investors. The market is still stuck in a broad consolidation phase following a violent correction that drove Bitcoin from the $80,000 region toward the low $60,000s. But despite the bearish pressure that persisted throughout June, there are indications that a big move might be on the horizon.
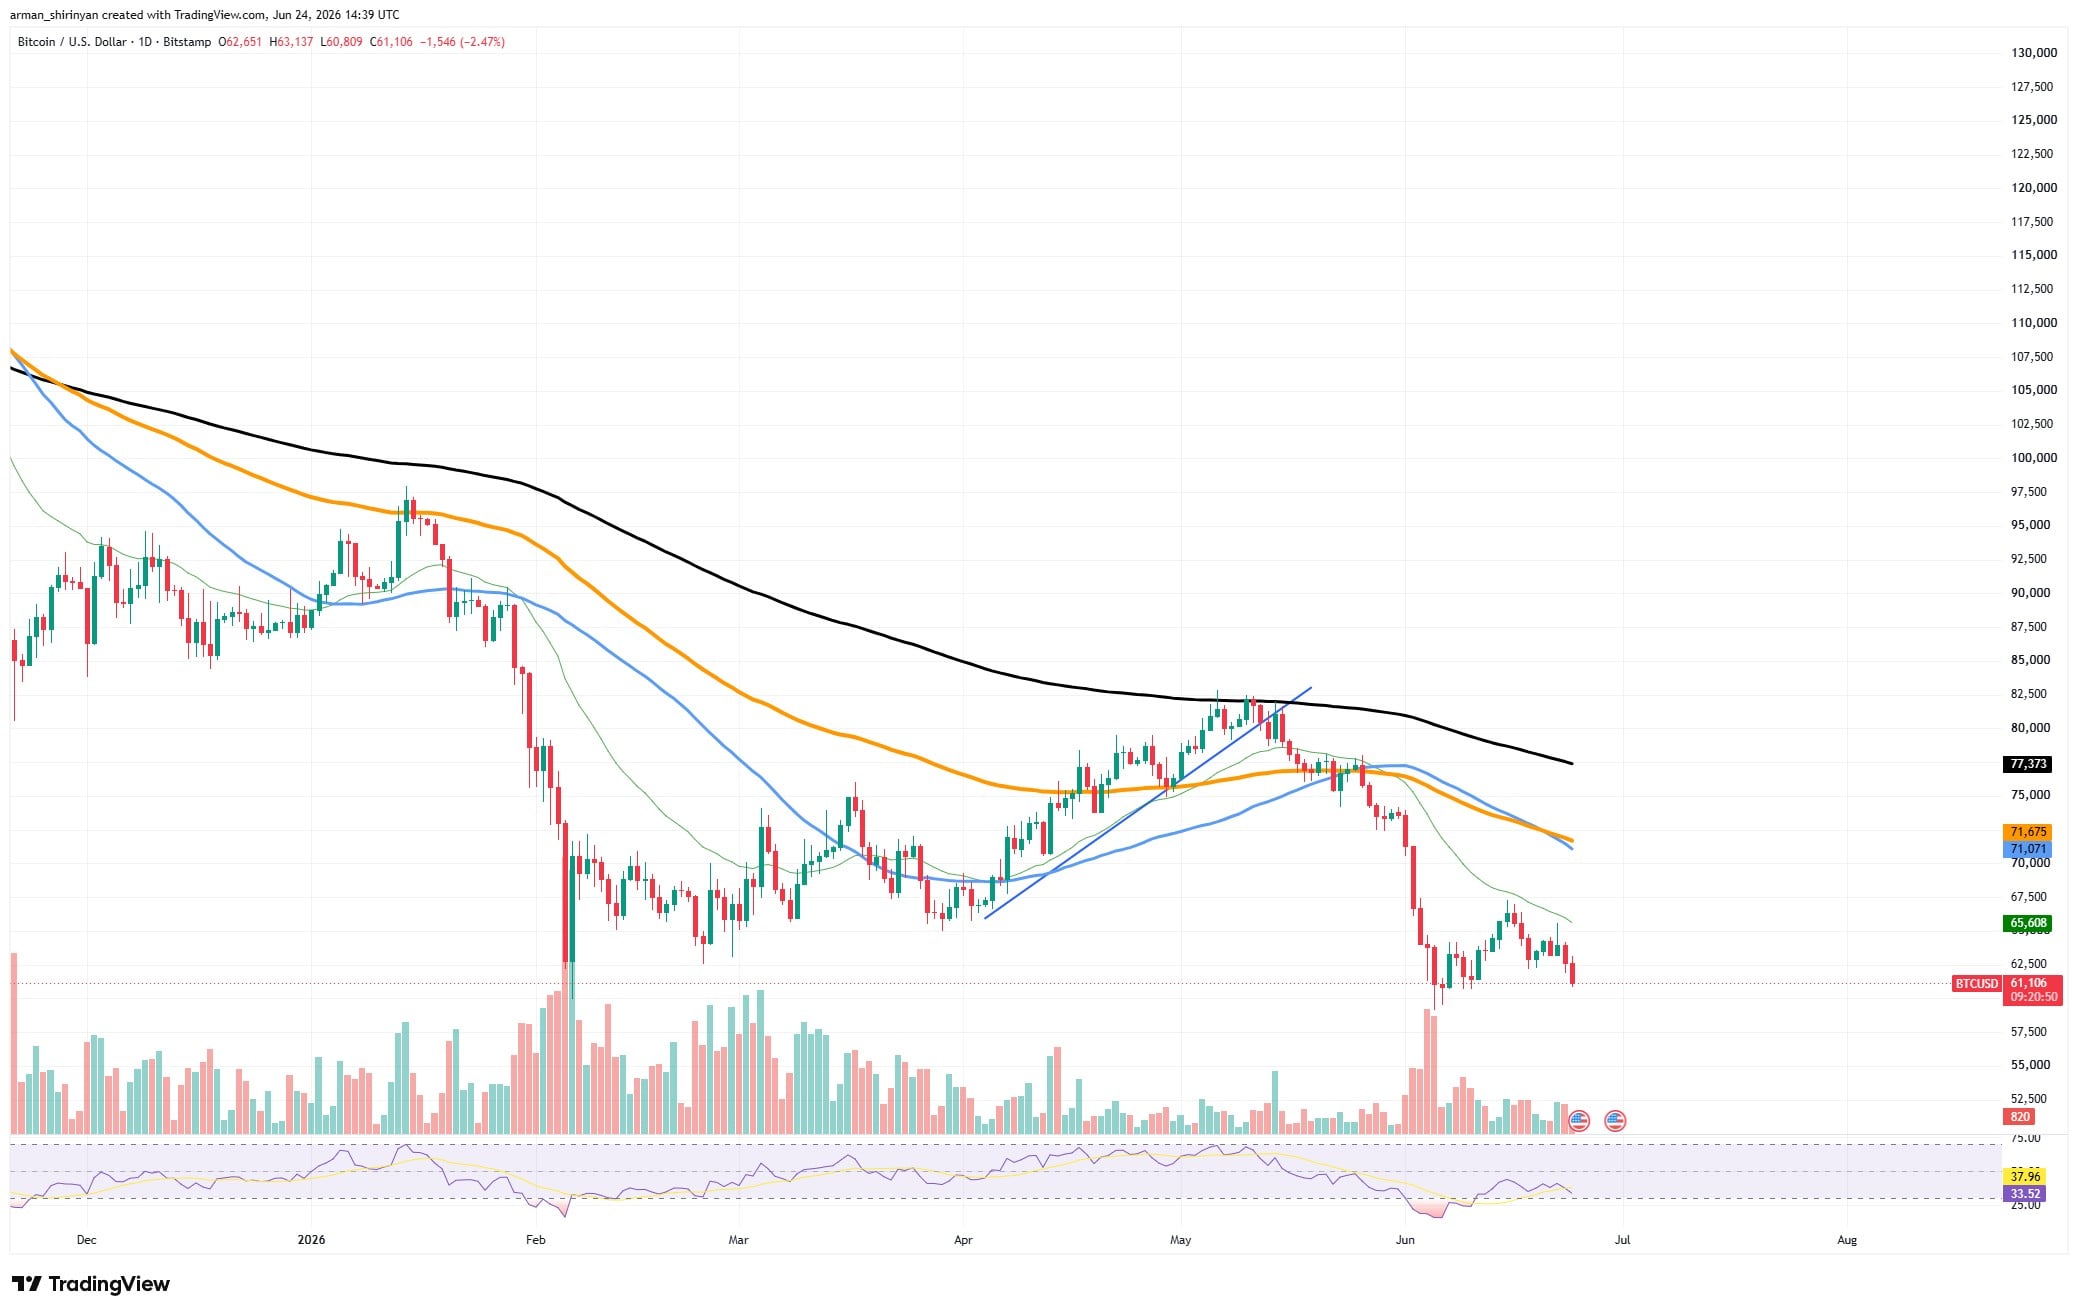
Bitcoin is currently trading close to $61,000 following yet another rejection by short-term resistance. The asset is still below its important moving averages, such as the declining 50-day and 100-day trends. Technically speaking, bulls don’t have much to celebrate. In the larger market structure, sellers continue to have the upper hand. However, the story has another side. The fact that Bitcoin has consistently protected the $60,000-$61,000 range is one of the chart’s most significant findings.
You Might Also Like

Bears were unable to spark another wave of panic selling after the dramatic capitulation event earlier this month. Rather, Bitcoin entered a comparatively narrow range, indicating that supply might be progressively running out. Volume behavior lends credence to this interpretation.
The initial collapse saw the biggest volume spikes, which were indicative of forced selling and extensive liquidation. Since then, trading activity has returned to normal, which frequently occurs when markets start to form a local bottom instead of moving quickly toward another leg lower.
The Relative Strength Index has recovered from oversold conditions and is now in neutral territory. This is noteworthy because it indicates that momentum has stabilized without necessitating a significant price rebound. Larger directional movements are frequently preceded by such behavior.
The $65,000-$66,000 range is still the crucial area to monitor. The short-term moving average, which has consistently rejected bullish attempts, aligns with this region. A clear breakout above it would likely force short sellers to cover their positions, which could lead to a move toward the much more significant resistance area between $70,000 and $72,000.
As long as Bitcoin is trading below those levels, the bearish scenario is still in effect. But the longer Bitcoin stays above the recent lows without plummeting, the more probable it is that the market is getting ready for a more robust comeback.
Will Ethereum stabilize?
After one of the biggest corrections of the year, Ethereum seems to be entering a phase of stabilization. The second-largest cryptocurrency, ETH, is currently trading in the $1,650-$1,700 range in an effort to form a local bottom after a sharp sell-off that forced it below a number of important support levels.
Ethereum is still clearly below all of the major moving averages on the chart, indicating that the overall trend is still negative. The substantial damage done to market structure over the past few months is reflected in the 50-, 100-, and 200-day moving averages, which are still sloping downward.
Bulls still haven’t reclaimed any significant resistance area. However, there are early indications that selling pressure might be waning. Ethereum was able to produce a modest recovery following the sharp decline toward the $1,600 area, and it has spent several sessions consolidating rather than falling further.
You Might Also Like

Following a capitulation event, this kind of price behavior frequently shows that market participants are assessing fair value. The interpretation is supported by volume patterns. The breakdown saw the most trading activity, which may indicate a wave of panic selling and forced liquidations.
Volume has since steadily decreased, which usually coincides with the establishment of a temporary equilibrium between buyers and sellers. Ethereum’s situation is still precarious until then. Although the recent stabilization is encouraging, there is still no evidence of a wider trend reversal. While the market awaits ETH’s next big move, the cryptocurrency is currently holding steady at $1,700.

Be the first to comment