


XRP’s crowd sentiment has collapsed to its lowest reading since October 2025 while price structure remains bearish on the 4-hour chart, creating a setup where the technical and psychological pictures are aligned.
Key Takeaways
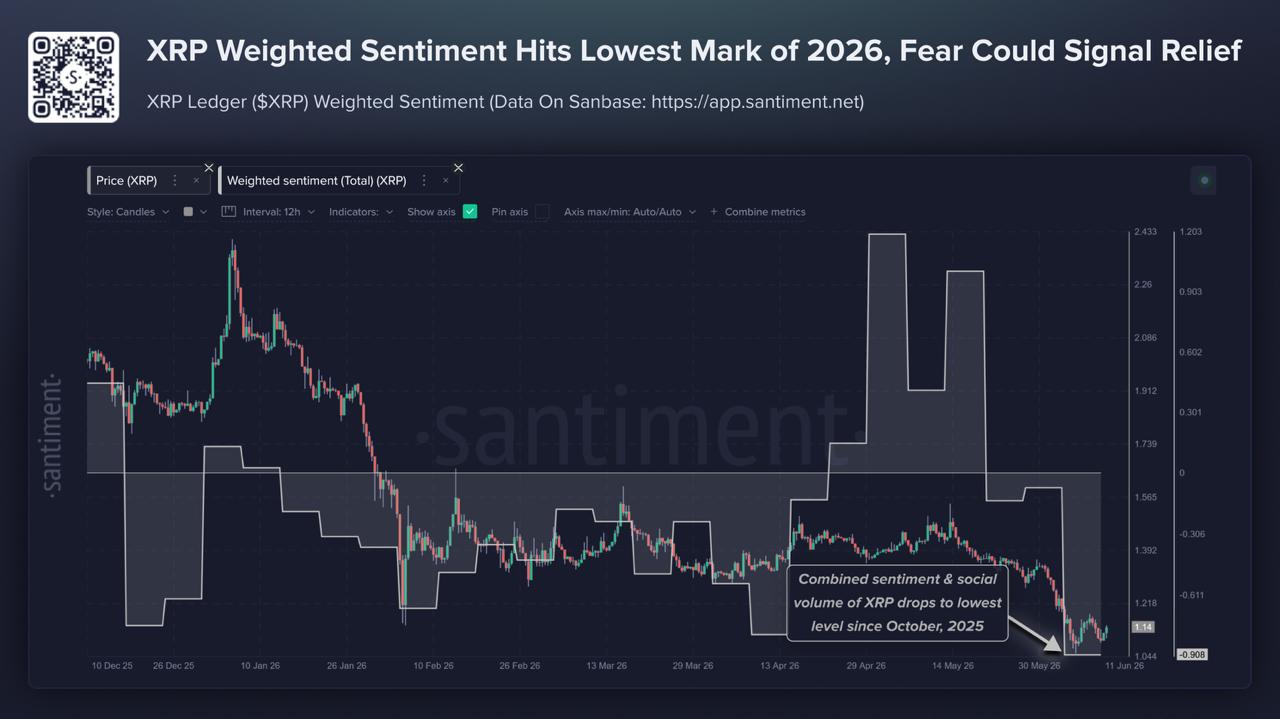
- XRP weighted sentiment drops to 8-month lows, last seen in October 2025.
- Price trades at $1.1287, with lower highs since June 8.
- All three SMAs falling and stacked bearish: SMA50 $1.1323, SMA100 $1.2156, SMA200 $1.3077.
- $1.09 support shelf has held three times; its loss would open $1.06.
- Roughly $8 billion left XRP’s market cap in early June as Bitcoin fell toward $67,000.
Sentiment: 8-Month Low With a Contrarian Edge
According to Santiment data, XRP’s weighted sentiment, which combines social volume with the ratio of positive to negative commentary, has fallen to its lowest level since October 2025. The fatigue has a paper trail. XRP shed roughly 10% in the first three days of June, erasing about $8 billion in market cap. The June 1 escrow release of 1 billion XRP added a familiar supply overhang at the worst possible moment.
Also XRP broke support at $1.25 even as exchange balances declined and ETF inflows stayed strong – the market is ignoring bullish data, behavior that typically appears late in downtrends. Even the CLARITY Act clearing its biggest procedural hurdle failed to move price. When confirmed positive catalysts produce no bid, traders stop watching.
That disinterest is precisely where the contrarian case lives. Some of XRP’s strongest historical rebounds have occurred at comparable sentiment lows, when most discouraged participants had already sold or moved on, leaving little supply pressure behind.
The crowd’s silence also says nothing about the ledger itself. On June 11, Ripple confirmed its role in Mastercard’s Agent Pay for Machines service, positioning the XRPL as a settlement layer for AI-driven payments, and released an XRPL AI Starter Kit for developers the same day. Work on XRPL version 3.2.0, focused on hardening network security ahead of institutional tokenization use cases, is also underway. The fundamentals haven’t deteriorated – only the crowd’s attention has.
Technical Structure: Bearish Until $1.18 Breaks
XRP/USD on the 4-hour chart as of June 12 shows price at $1.1287, up 1.2% for the past 24h, probably because Donald Trump said that a deal with Iran is done, but the structure remains bearish. A sequence of lower highs has been in place since the June 8 rejection at $1.18, and all three SMAs are falling in a bearish stack: SMA50 at $1.1323, SMA100 at $1.2156, and SMA200 at $1.3077.
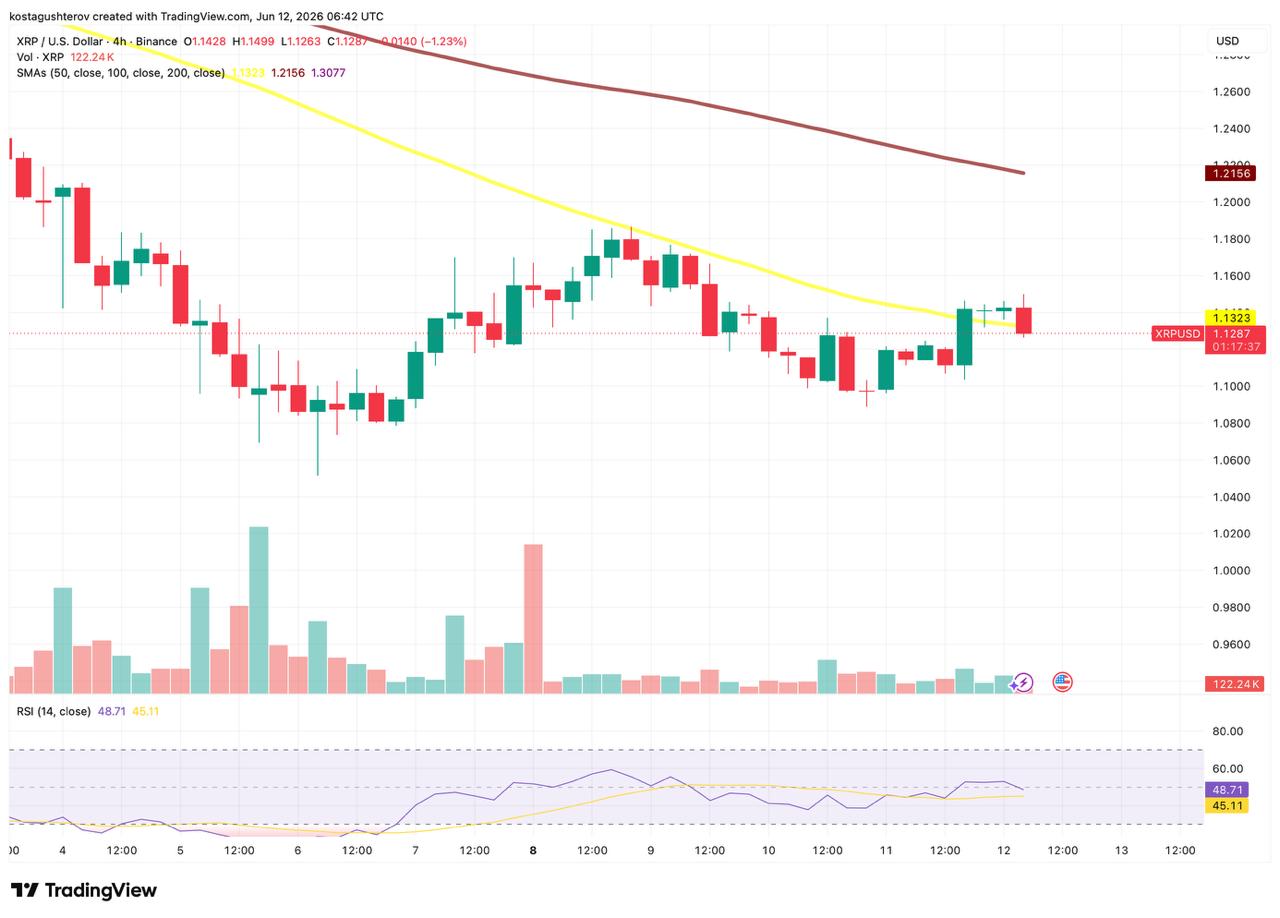
Price is currently testing the SMA50 from below and failing to sustain above it. RSI sits at 48.71 – neutral, offering no directional confirmation. Volume has faded since the June 8 distribution spike, meaning the bounce off $1.09 lacks meaningful participation.
Bearish Scenario
A rejection at the SMA50 with a 4-hour close below $1.1263 could confirm the current bounce as a dead-cat move rather than a trend shift. That opens the $1.09–1.10 shelf, where buyers have stepped in three times in past days. If that shelf breaks on rising volume, the $1.06 swing low from June 6 becomes the next target. RSI rolling back below 45 would support the bearish case.
Bullish Scenario
A 4-hour close above the SMA50 at $1.1323 with volume expansion could flip that level to support and open the path toward $1.15, then the $1.18 supply zone. Reclaiming $1.18 would break the lower-high sequence and put the SMA100 near $1.21 in play. RSI holding above 50 could confirm momentum shifting. Until price clears $1.18, any move up remains a correction inside a downtrend.
Our take
The trend, MA stack, and fading volume all point the same direction – down. Sellers remain in control of the structure, and nothing on this chart suggests that has changed yet.
The one thing worth sitting with is the sentiment reading. When a market gets this universally ignored, the next move often surprises the majority. But sentiment alone doesn’t move price – it sets a condition. The trigger still has to come from the chart, and right now the chart hasn’t given it. Until XRP closes above $1.18 and breaks the lower-high sequence, every bounce remains a move inside a downtrend rather than the start of a new one.
One external variable worth monitoring: if the ongoing US-Iran negotiations move from rhetoric to a signed agreement, the broader risk appetite shift could provide the macro catalyst this chart is currently missing. A confirmed deal would likely compress risk premiums across crypto and could give XRP the external push needed to challenge the $1.18 level with conviction.
This article is for informational and research purposes only and does not constitute financial or investment advice. Nothing in this content should be interpreted as a recommendation to buy, sell, or hold any digital asset. Always conduct your own research before making any investment decisions.

Kosta has reported on cryptocurrency markets and blockchain infrastructure since 2020, bringing over six years of hands-on experience in the crypto industry built through daily tracking of markets, trends, and emerging blockchain developments. Specializing in Bitcoin on-chain analysis, institutional ETF flows, and digital asset price action, his work at Coindoo has been cited by other news agencies and consistently covers market developments with a focus on data-driven reporting across Bitcoin, Ethereum, Solana, and XRP.
Over the years, Kosta has contributed to multiple crypto media outlets in different regions, authoring over 6,000 articles across the sector. His reporting spans cryptocurrency markets and the broader fintech industry, tracking not only price action but also the technological and regulatory forces shaping the ecosystem.
To support his analysis, Kosta actively leverages on-chain data and metrics from leading platforms such as Santiment, Glassnode, and CryptoQuant, enabling deeper, evidence-based market insights. He believes in the power of transparency and the data that underpins the blockchain ecosystem.
His academic background in Marketing Management from Denmark further complements his analytical approach, adding a strong understanding of communication strategy and content positioning to his work.

Be the first to comment