


Following one of its biggest daily movements of the year, XRP has completely altered its short-term technical structure. After briefly rising to about $1.70, the asset is currently trading at about $1.49. The breakout was accompanied by a significant increase in trading volume.
XRP’s fundamental improvements
Most significantly, the whole cluster of major moving averages has been cleared by XRP. The shorter averages are located much lower at about $1.10-$1.18, while the long-term moving average near $1.35 served as the last significant dynamic resistance. Therefore, holding above $1.35 would indicate a significant structural improvement as opposed to a brief spike in volatility.
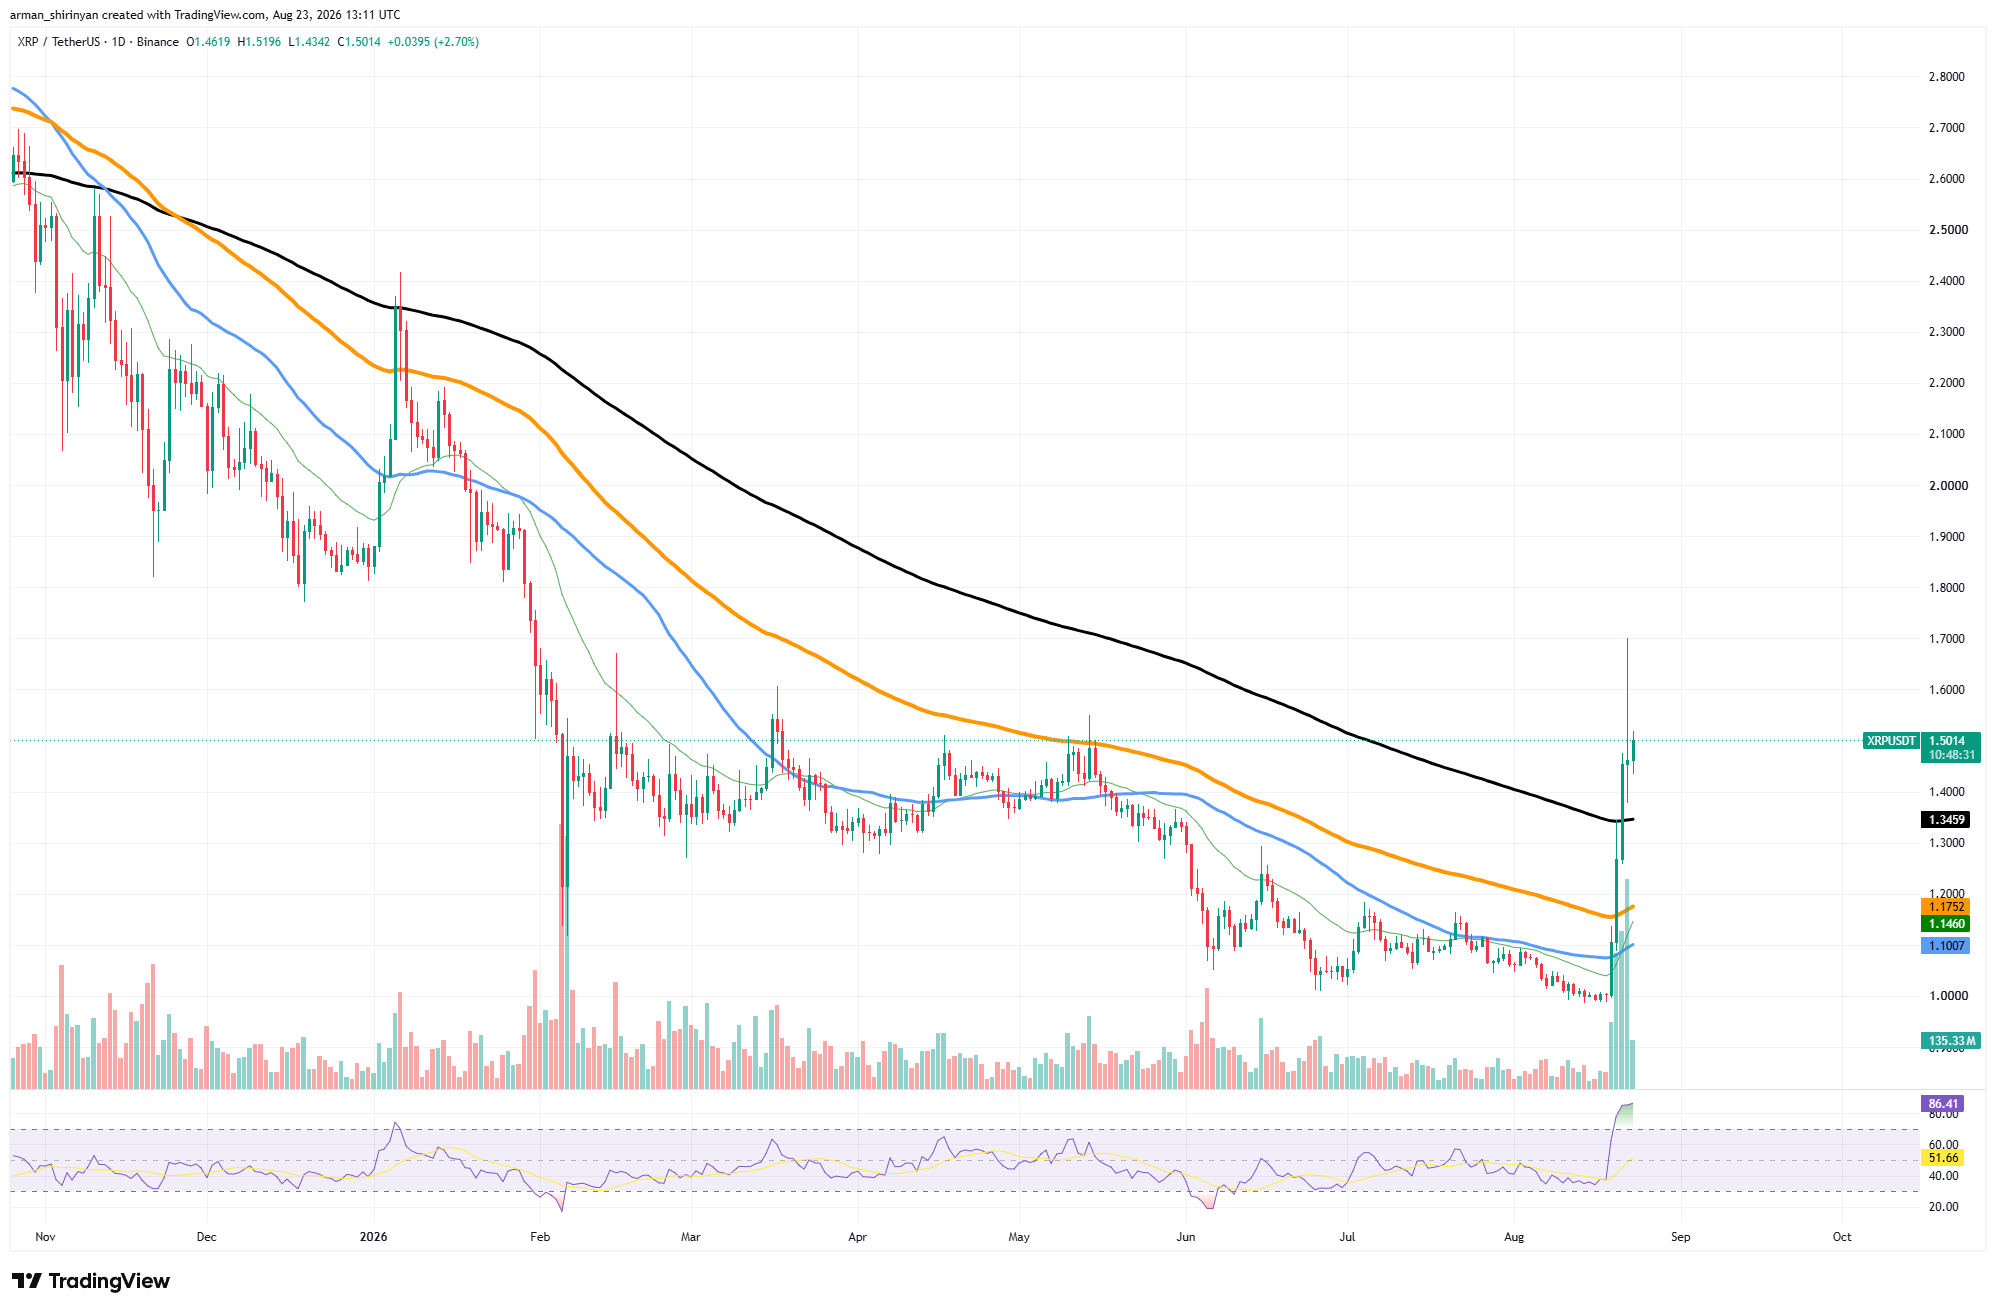
But the rally has grown incredibly long. With a daily RSI of about 86, XRP is extremely overbought. Additionally, the lengthy upper wick at $1.70 indicates that sellers have already reacted forcefully at higher prices. The $1. 50-$1. 55 area is the immediate problem. The route toward $1.60 and ultimately the most recent intraday peak of $1.70 could be reopened by a daily close above this area.

You Might Also Like

XRP would have comparatively little visible resistance before the $1.80-$2.00 range if it broke $1.70. A correction wouldn’t always render the breakout invalid. The long-term moving average and the breakout area are located at $1.35, which is the first significant support.
The larger recovery structure is maintained if XRP is able to establish that level as support. However, a decline below $1. 35 would increase the likelihood that the explosive move was an exhaustion event rather than the start of a long-term trend reversal.
Shiba Inu building recovery structure
After months of consistent downward pressure, Shiba Inu is trying to build a recovery structure, but the most recent rejection indicates that bulls have not yet achieved a complete trend reversal. Following an explosive move that momentarily raised the token above $0.00000600, SHIB is currently trading around $0.00000544.
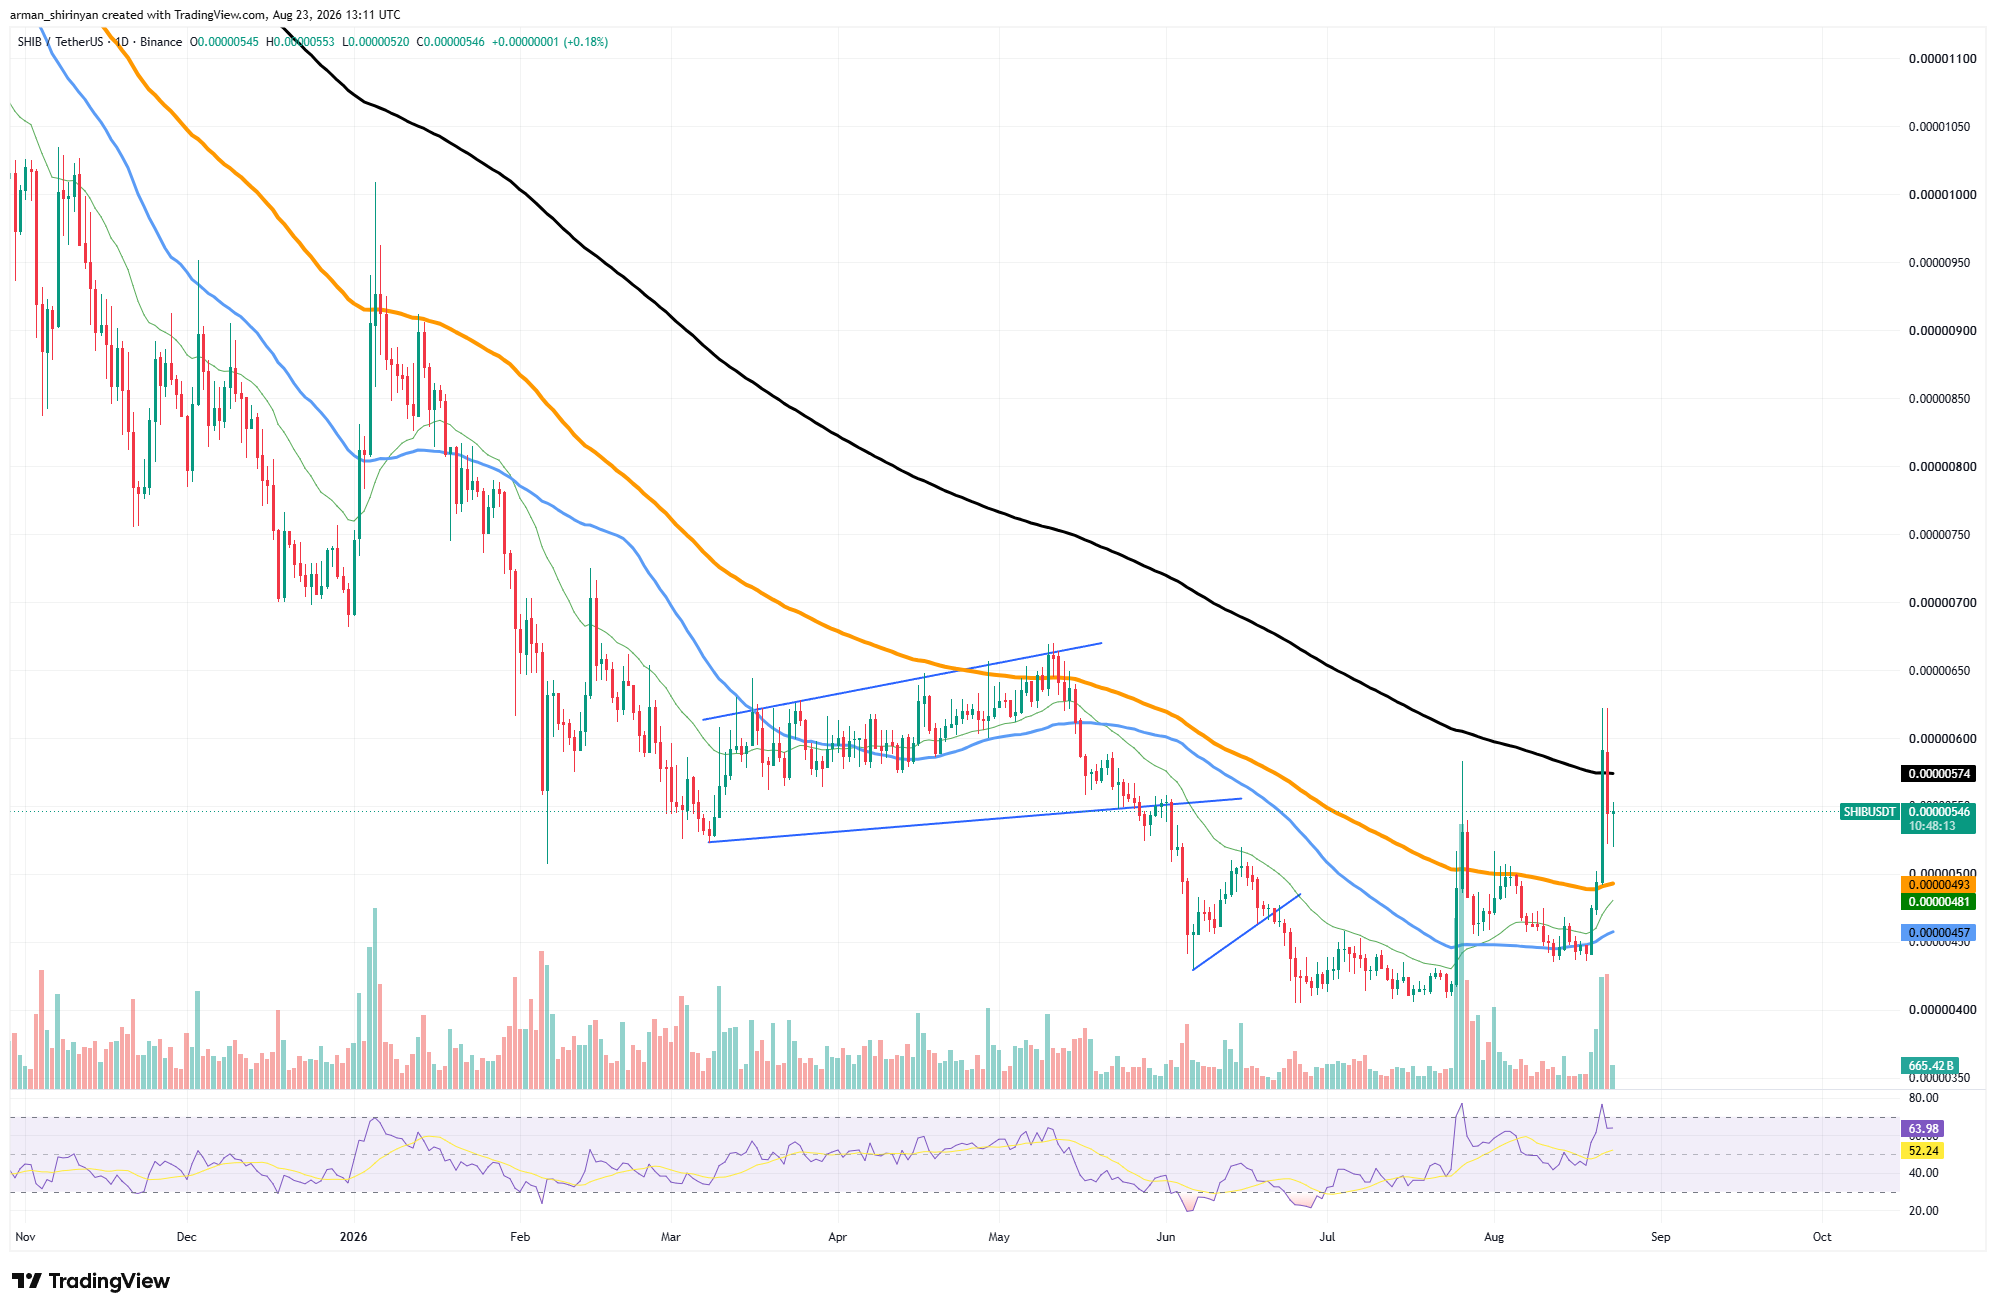
The long-term moving average, which is currently at $0.000574, was the most significant technical barrier in the current setup since that rally was promptly rejected close to it. The fact that SHIB is still higher than its shorter moving averages is a positive development. The token has recovered the orange average at $0.00000493, and there is more support at $0.00000480 and $0. 00000457.
You Might Also Like

As a result, the short-term structure is significantly healthier than it was in June and July. It has also gained momentum. After the rejection, RSI is now close to 64, above its signal line but not overbought. During the breakout attempt, trading volume increased significantly, indicating real market participation as opposed to a low-liquidity drift higher.
Now, SHIB must convert $0. 00000550-$0. 00000575 into support. The former March-May consolidation zone, which is located between $0. 00000620 and $0. 00000660, would be exposed after a clear break above the long-term moving average at roughly $0.00000600.
SHIB would remain susceptible to another retracement if that obstacle was not overcome. The current recovery would be weakened if the token lost $0. 00000490, and it would revert to its previous bearish structure if it moved below roughly $0. 00000455. The long-term resistance directly overhead continues to be the crucial test, but for now, SHIB has momentum.
Hyperliquid’s skyrocketing continues
After momentarily reaching about $82.50, Hyperliquid has continued its breakout and is currently trading around $80. The move confirms that the August recovery has grown into a much larger bullish impulse and places HYPE firmly above its prior June-July peaks around $75–$77, giving the token a new local high.
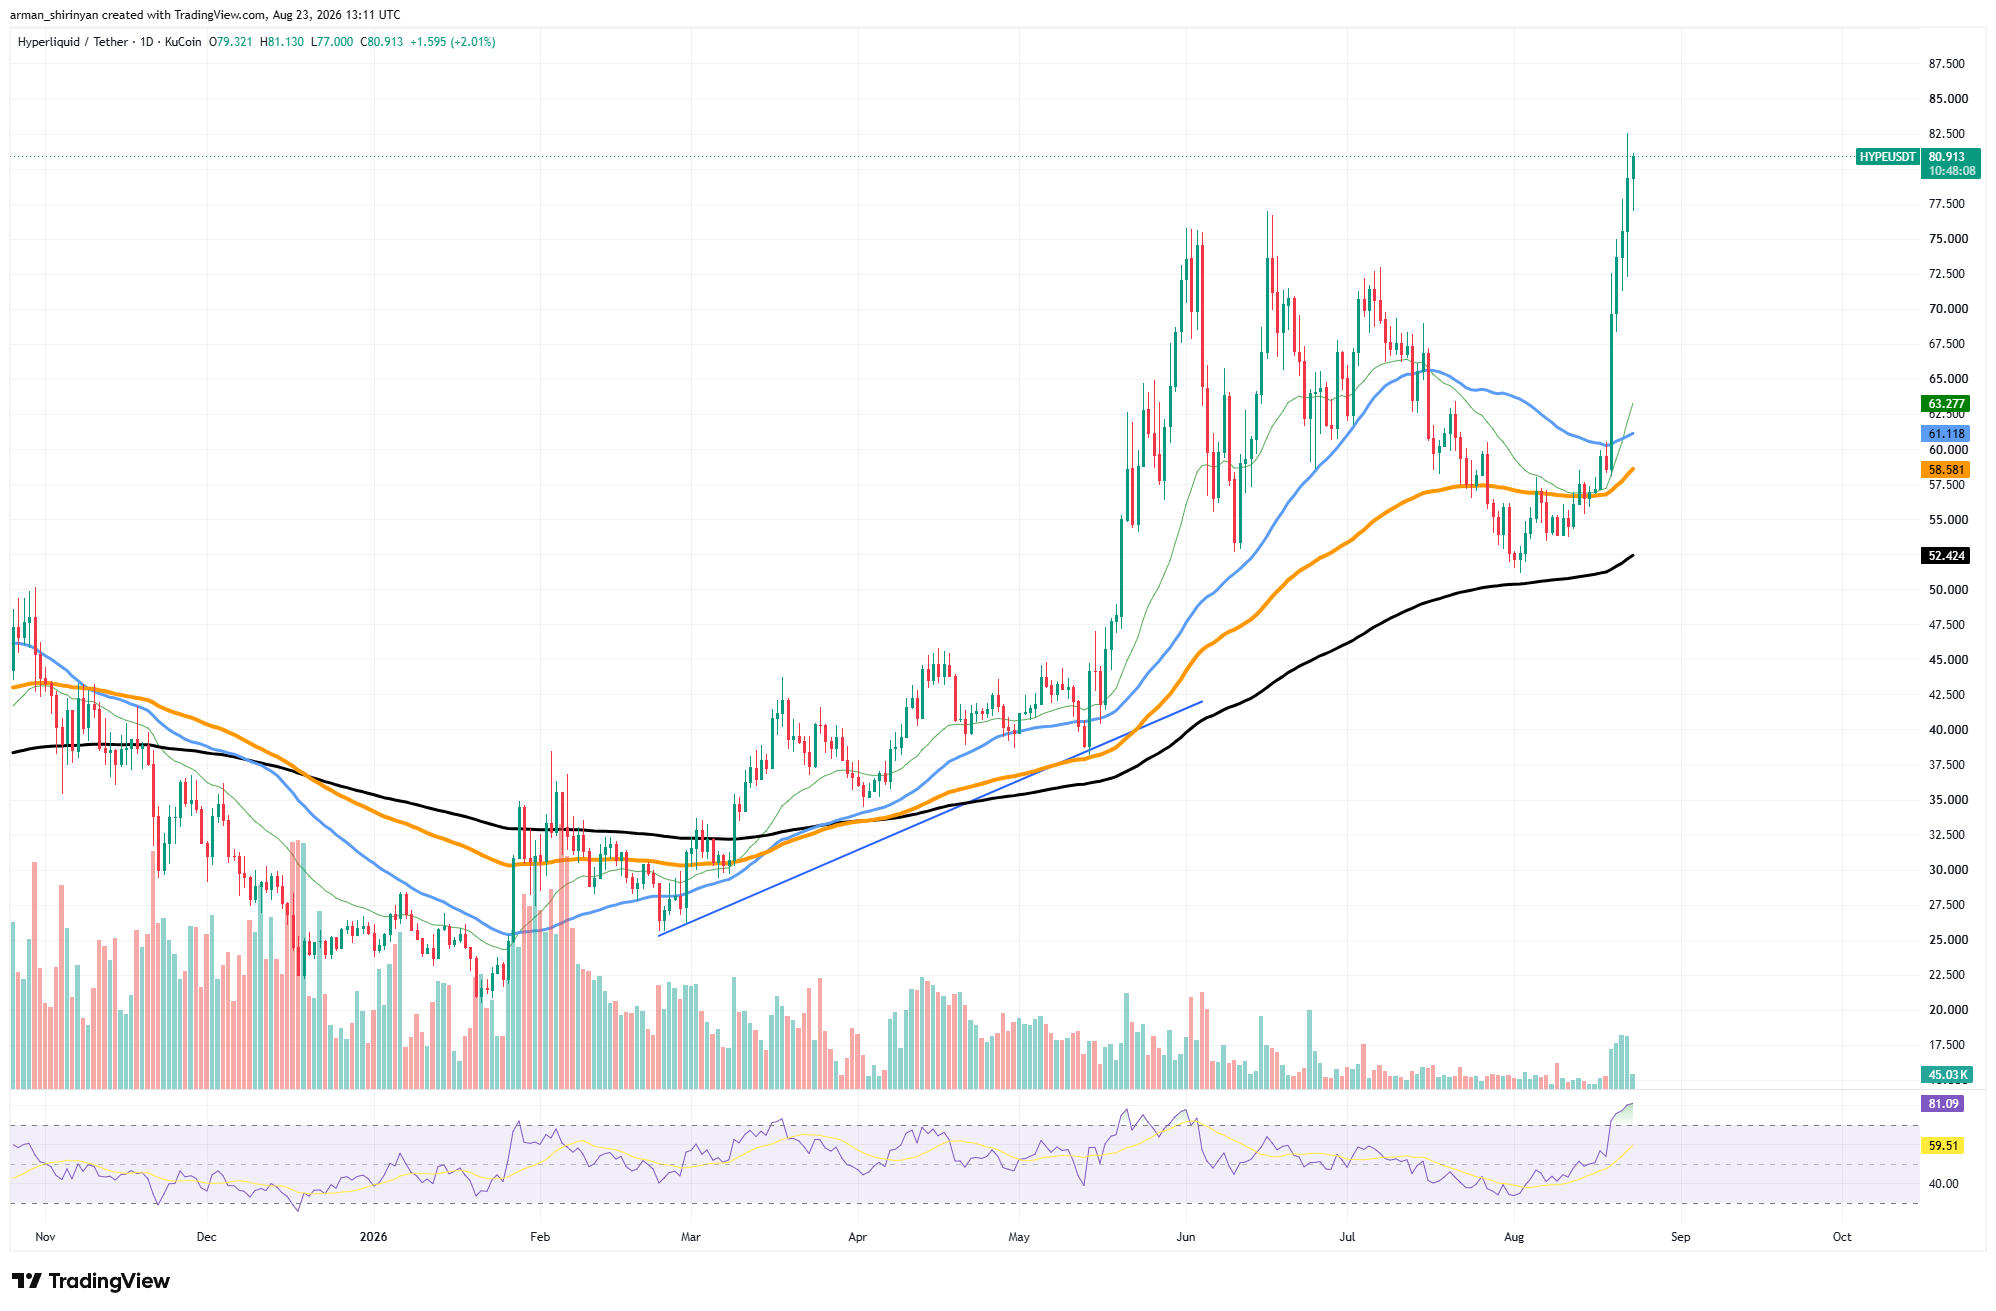
Technically, the structure is very robust. With dynamic support presently concentrated around $63. 21, $61.10, and $58.56, HYPE trades significantly above all major moving averages. Near $52.42, the long-term average is still significantly lower. The distance between price and these averages illustrates both the strength of the move and the length of HYPE.
The biggest immediate risk is now that extension. At 80. 55, the daily RSI is clearly in overbought territory. Additionally, volume has increased significantly during the breakout, bolstering the move’s legitimacy and raising the likelihood of profit-taking following such quick appreciation.
You Might Also Like

Keeping the price between $75 and $77 is now crucial for bulls. The first significant area of support ought to be this former resistance zone. A path toward $82. 50 and possibly $85-$87.50 would be preserved if it were held. While HYPE’s overall structure is still bullish while it remains significantly above the $60-$63 region, a decline below $75 would instead raise the likelihood of a deeper retest toward $70.
Bitcoin’s breakout might slow down
Bitcoin has experienced a significant technical breakout, rising from the consolidation range of $63,000 to $65,000 to roughly $77,000 in a few daily sessions. More significantly, one of the strongest technical barriers that had kept the price contained since the start of the wider downtrend has been removed as Bitcoin has crossed its long-term moving average at roughly $71,689.
The move’s credibility was increased by the breakout’s significant volume expansion. Additionally, Bitcoin trades well above its shorter moving averages, which are currently centered between $65,100 and $67,500. Momentum, however, is now severely stretched. The daily RSI is at about 80, while its moving average is at about 58 points.
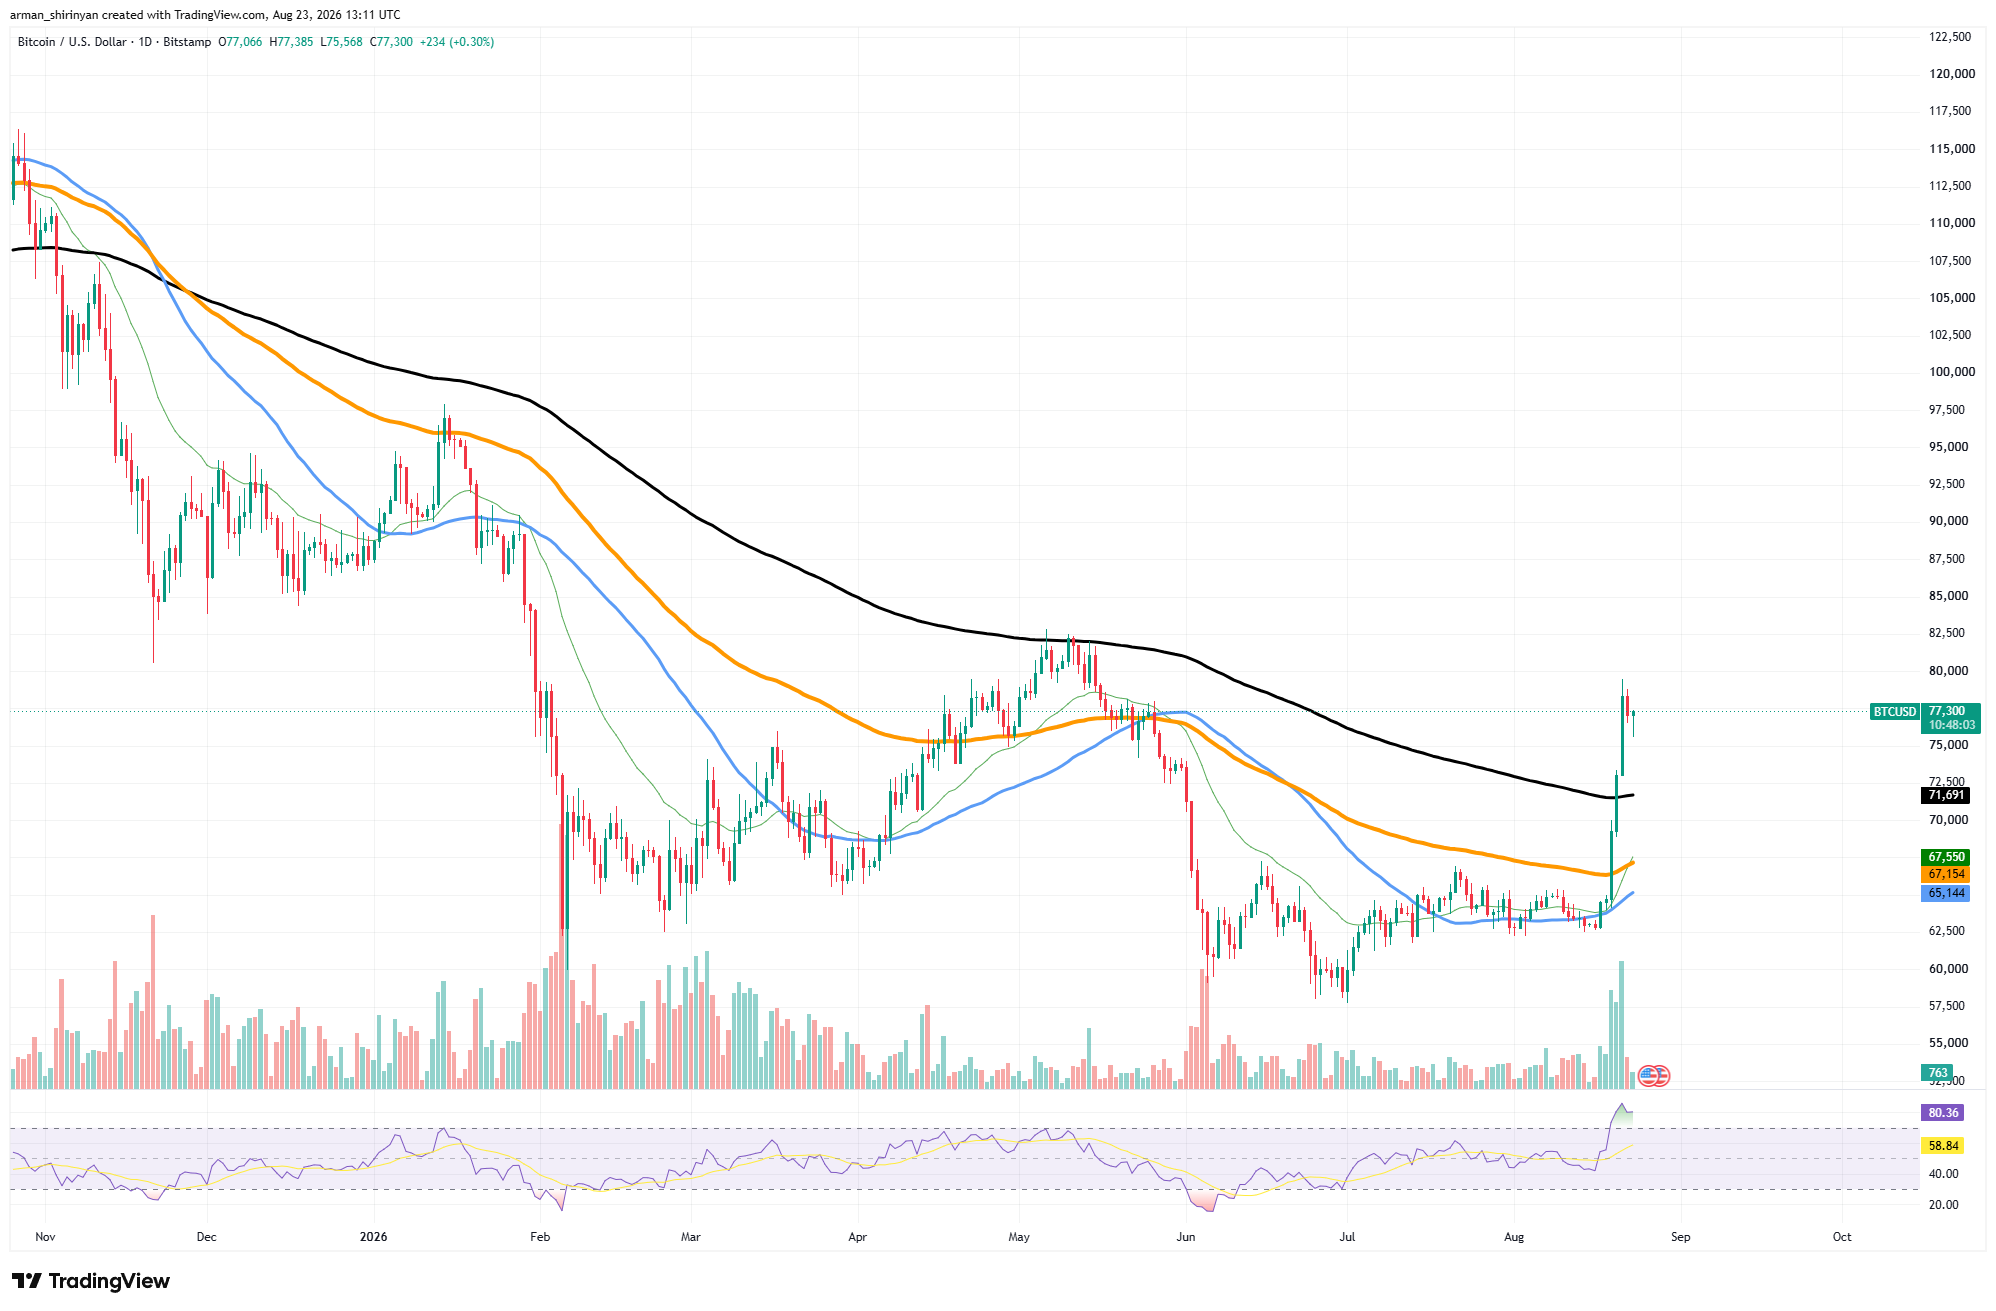
That does not necessarily mean a quick reversal, but it does make further upside more reliant on consistent buying as opposed to just momentum continuation. The May peak is located between $82,000 and $82,500, and the first resistance is located around $80,000. The $85,000 region might become visible if that area were cleared, which would be another significant structural improvement.
You Might Also Like

On a pullback, the more crucial test might occur. Because it includes the recently reclaimed long-term moving average and breakout region, the $71,500–$72,500 area now serves as the crucial support zone.
The claim that Bitcoin has moved out of its prior bearish structure would be strengthened by a successful retest. That thesis would be undermined if $71,500 were lost, exposing $67,000 to $68,000. Although BTC has currently reached the necessary breakout bulls, consolidation would be preferable to another quick vertical advance due to its overbought momentum.



Be the first to comment