


What to know:
- XRP nears $1.53 resistance as consolidation tightens and signals a decisive move.
- Wave E structure targets the $1.50–$1.53 range, while $1.39 remains key support.
- RSI holds at 55.45 as volume drops and liquidations show pressure on longs.

As of April 22, 2026, XRP is nearing a critical resistance zone near $1.53 as consolidation tightens on the daily chart. Analysts highlight a decisive phase ahead, with price action approaching a level that could determine the next directional move in the short term.
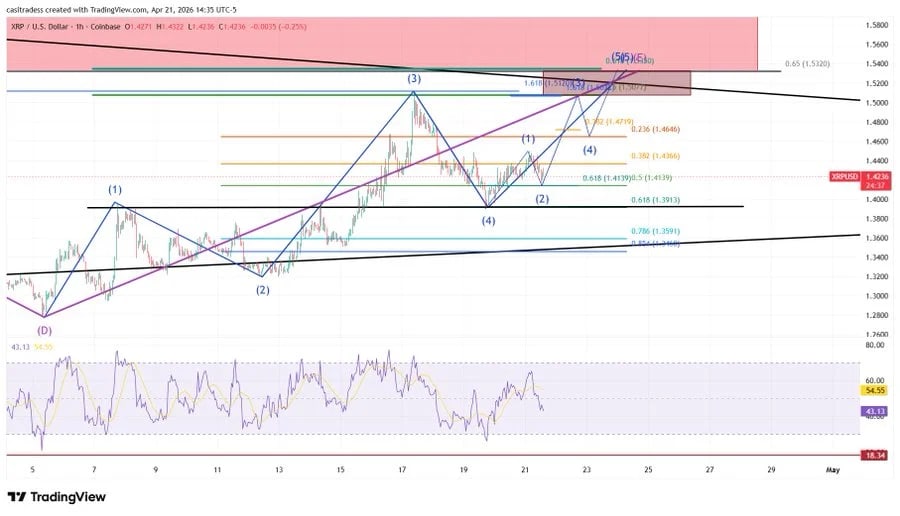
XRP Wave E Targets $1.53
Crypto analyst CasiTrades highlighted that XRP is completing Wave E within a broader consolidation structure. Subwave formations indicate the $1.50 to $1.53 range as the main resistance zone.
The analyst expects a few more upward waves toward this level. The structure remains valid while the price holds above $1.39 support.

Also Read: XRP Holds Crucial Level as Indicators Show Weak Market Strength
The analyst also pointed to the possibility of connection with the movement of Bitcoin. An upward shift to $79,000 in Bitcoin might coincide with XRP test resistance.
In case Bitcoin reaches its peak at this stage, XRP will not be able to reach $1.53. Any rejection at resistance would take XRP back to the $1.09-0.87 region.

CryptoWZRD, another analyst, shared a separate daily XRP outlook. He mentioned that the asset is closed without a clear decision and direction. An upward movement of over $1.4300 could provide a long position. Any failure beyond this might result in further lateral movement.


EMA Levels and RSI Show Neutral Trend
According to TradingView data, XRP is trading near $1.4259 on the daily timeframe. The 20-day EMA is at $1.39206, while the 50-day EMA stands at $1.41176. The price is near these short-term averages. Such positioning demonstrates a balanced structure with weak directional strength.
The higher EMAs show stronger resistance overhead. The EMA 100-day is at $1.53915, which is within the resistance zone. At a far barrier is the 200-day EMA at $1.78561. These levels outline significant levels in any continuous upward trend.
The Relative Strength Index (RSI) stands at 55.45 and its moving average at 52.50. This range shows stable momentum. It also indicates that the asset is not in an overbought condition.
Open Interest Declines as Longs Face Pressure
Derivatives data from CoinGlass reflects reduced market activity. The trading volume dropped by 19.88% to $3.00 billion. Open interest decreased by 1.79% to $2.57 billion. The OI-weighted funding rate is 0.0052%, which shows a very slight positive bias.
In the last 24 hours, liquidation data indicates that total liquidations amounted to $1.76 million. Long positions accounted for $1.23 million, while short liquidations were $534.21K. This distribution indicates more pressure on long positions in recent sessions.
This article contains market analysis and price predictions. These are not guarantees. Crypto markets are volatile. Always DYOR. Not financial advice.
Also Read: Bitcoin (BTC) Holds $75K as $292M Hack Shakes Market

Be the first to comment