

After the asset broke below a crucial horizontal support zone around $1.28-$1.30, XRP’s technical picture has drastically worsened. The breakdown firmly places sellers in control of the market and invalidates the multi-month consolidation pattern that had been emerging since March.
According to the chart, XRP is slipping below the local support floor and the lower edge of a descending triangle. More significantly, the price is currently trading below the 50-, 100-, and 200-day moving averages, forming a bearish alignment that has historically restricted attempts at recovery.
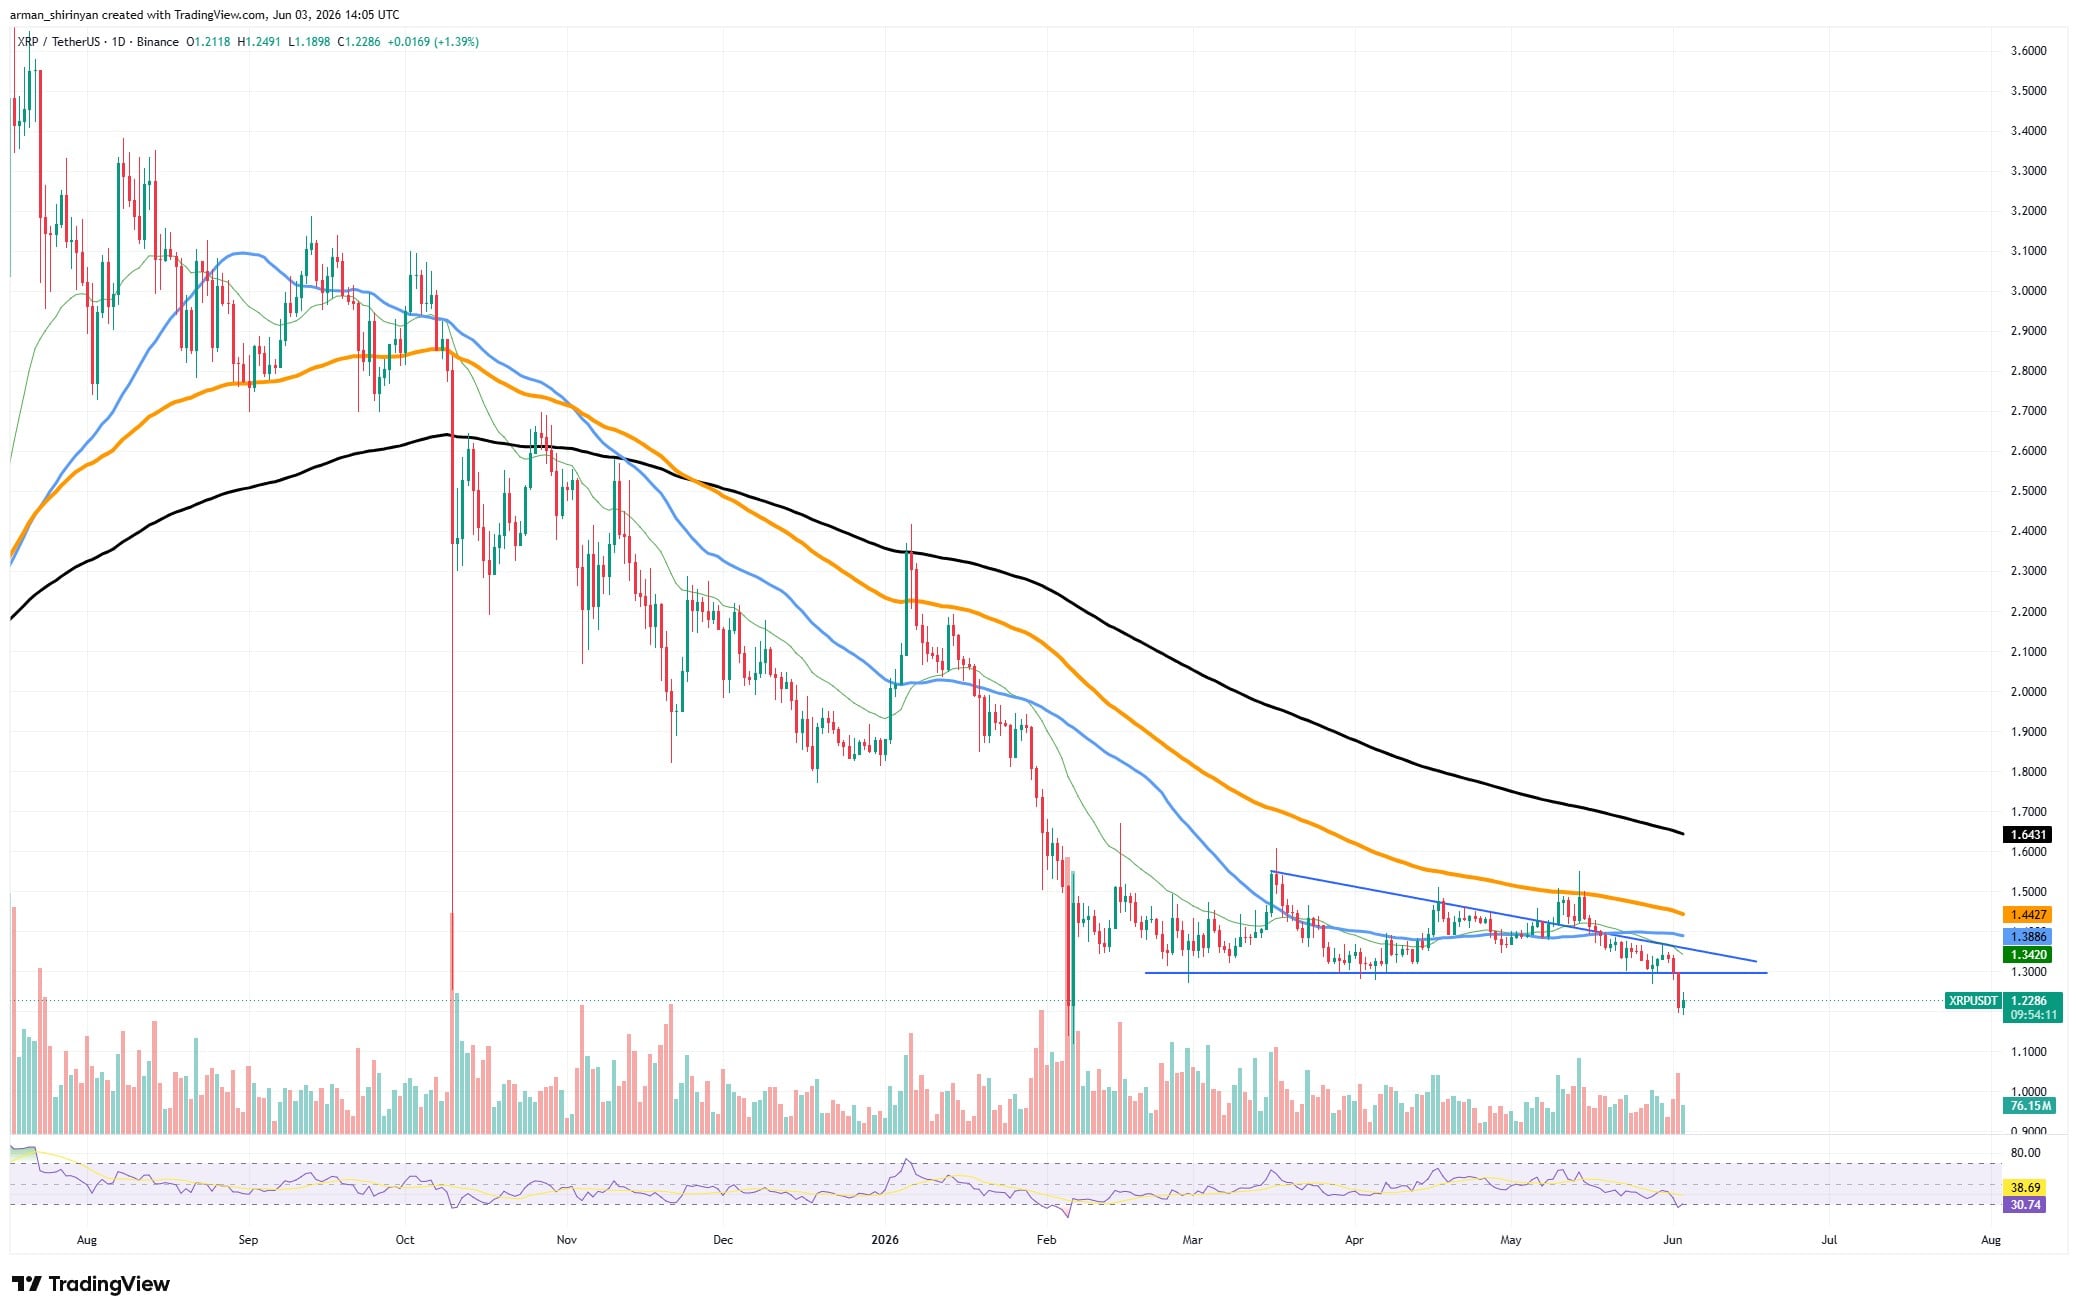
During the breakdown, volume increased, indicating that the move was more than just a transient liquidity event. The RSI is moving toward oversold territory, but there are still no indications of bullish divergence, suggesting that momentum indicators remain weak.

Regaining the $1.30 area is the bulls’ first priority. Any recovery rally is likely to run into resistance close to the declining trendline and the cluster of moving averages above $1.35-$1.45, while failing to do so could lead to deeper retracements.
The asset is still susceptible to further downside pressure in the near future unless XRP swiftly rises above previous support.
Strong ZEC recovery trend emerges
Zcash paints a nearly diametrically opposed picture.
The market is still rewarding ZEC with significant buying pressure despite the recent controversy surrounding reports of network problems. Over the past two months, the asset has been one of the best performers in the cryptocurrency market, rising from below $250 in April to above $600.
The price is still comfortably above all major moving averages, confirming the trend’s strength, as they continue to slope upward.
ZEC entered a volatile consolidation phase marked by significant daily swings after hitting highs close to $700. Even though this kind of volatility might seem alarming, it frequently occurs following parabolic advances as traders lock in profits and new buyers take positions.
The fact that every pullback finds support at ever-higher levels is the most positive indication. While the 100-day moving average at $485 indicates a deeper structural support level, the 50-day moving average at $556 has emerged as a significant dynamic support zone.
Despite weeks of consolidation, momentum remains positive, with the RSI remaining above neutral. Another challenge to the recent highs near $700 is still conceivable if buyers keep control above the $550 region.
While XRP is currently struggling to avoid a much deeper bearish continuation, ZEC clearly shows stronger technical strength between the two assets.
ADA Breaks Important Support
As the bears tighten their hold, ADA breaks important support.
After decisively breaking below the support zone that had been in place since February, Cardano has entered a precarious technical position. The move continued a downward trend that has dominated price action for the majority of the previous year, pushing ADA to new local lows close to $0.21.
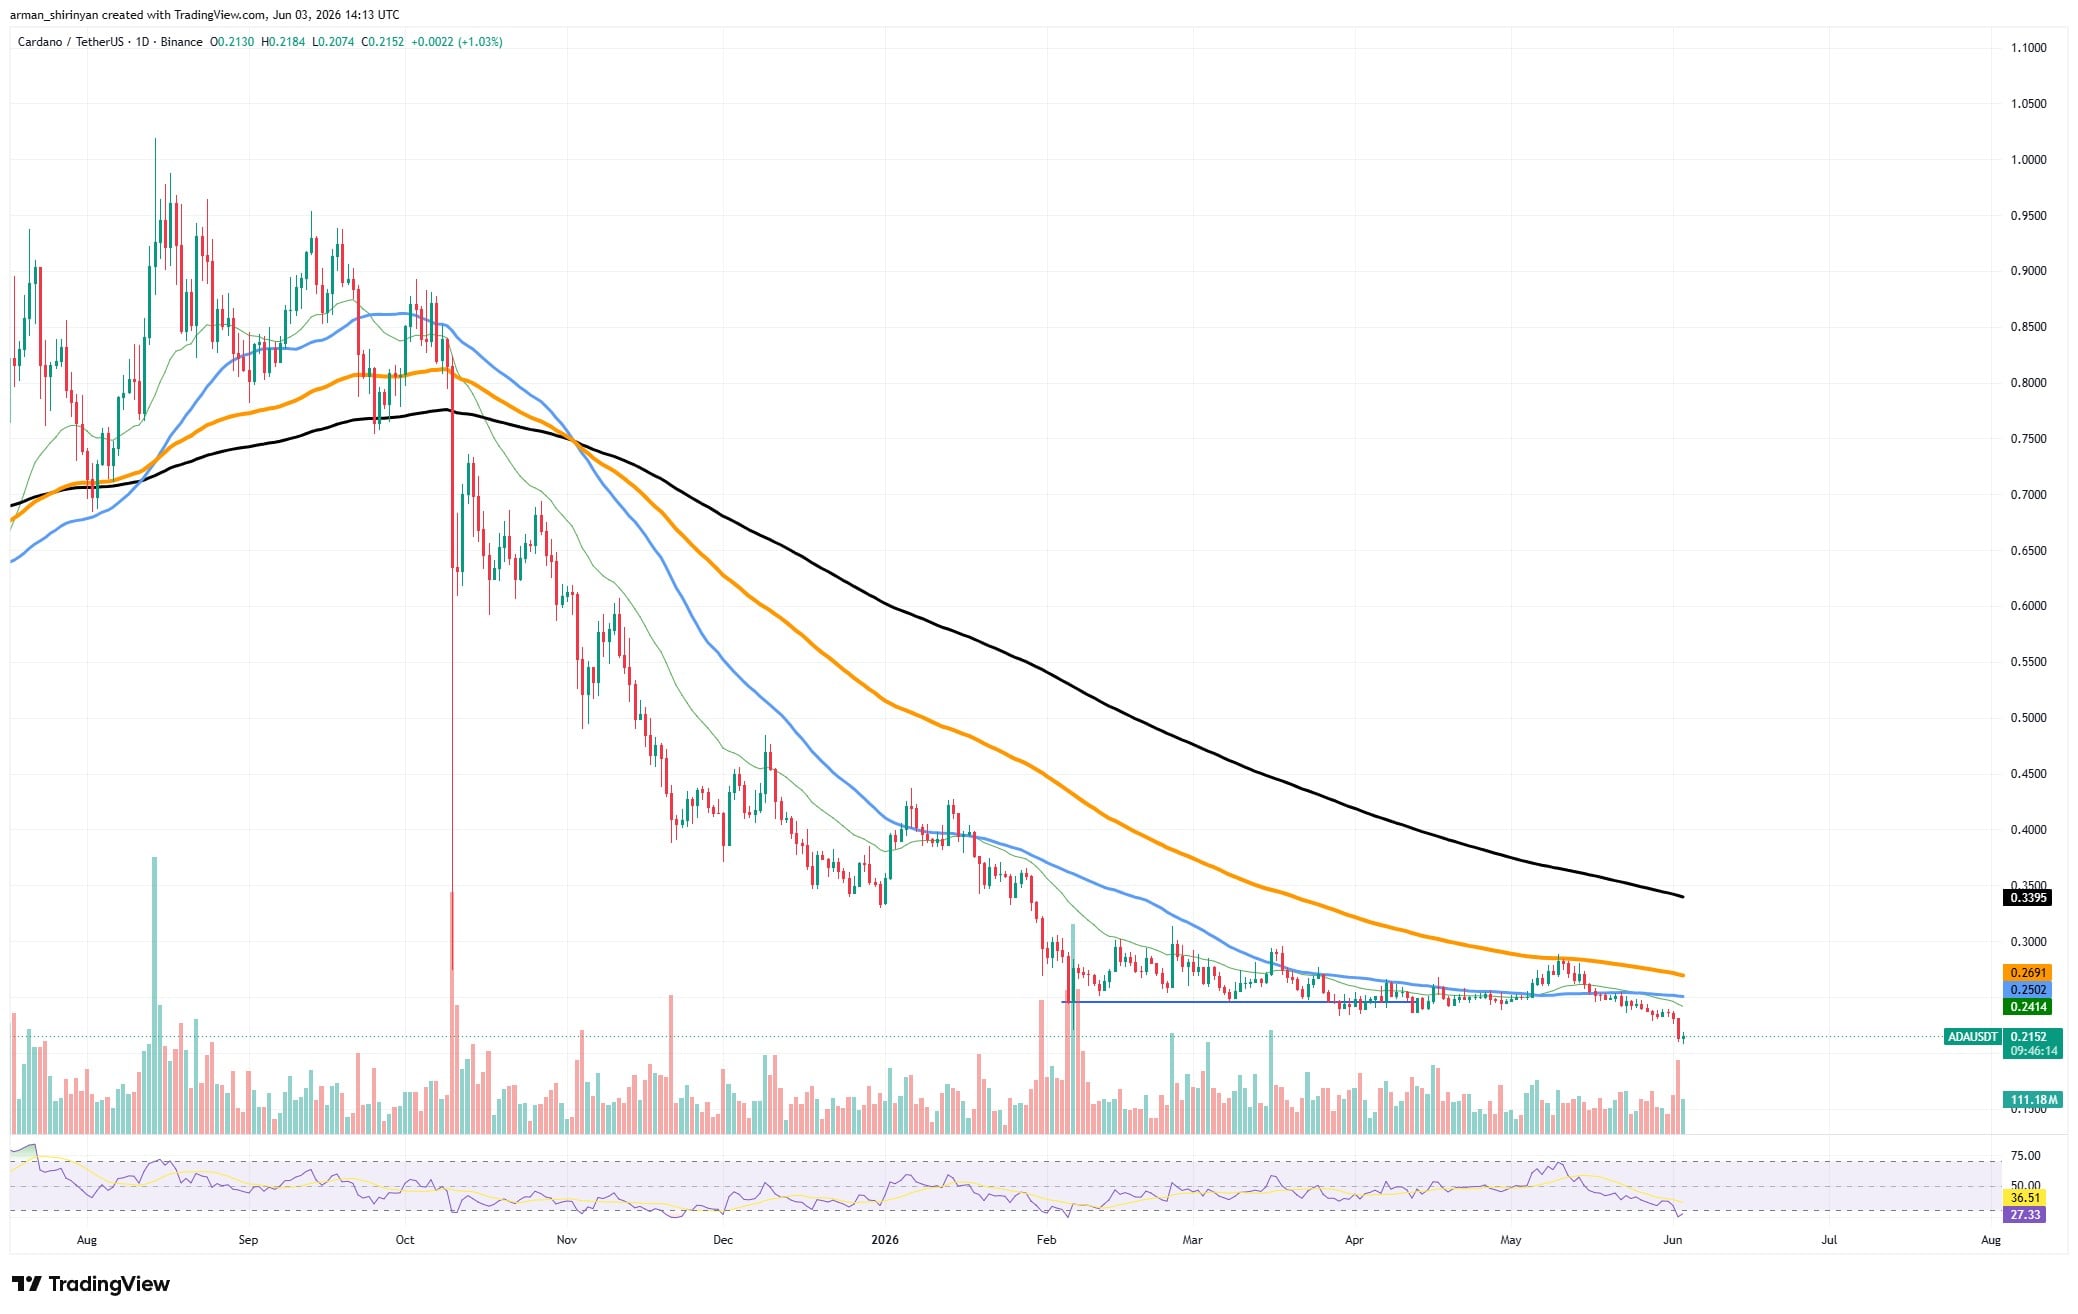
A distinct bearish structure can be seen in the chart. The 50-day, 100-day, and 200-day averages line up in a classic bearish formation, and ADA trades below all major moving averages.
Seller control has been strengthened by the fact that every attempt at recovery over the past few months has failed below decreasing resistance levels. Because it happened after months of sideways consolidation, the recent breakdown is especially concerning.
In this instance, the resolution favored the bears because such extended ranges frequently result in strong directional moves. Although momentum remains clearly negative, the RSI has moved toward oversold territory, which might permit a brief rebound.
It is crucial for bulls to recover the previous support area between $0.24 and $0.25. In the absence of that rebound, ADA runs the risk of going into a new leg lower as investors continue to shift their money toward assets that are performing better.
NEAR Explodes Higher
As momentum reaches unprecedented heights for the current market, NEAR explodes higher. NEAR has emerged as one of the top-performing major altcoins while ADA is having difficulties. After a nearly vertical rally that started in early May and produced gains of more than 100% in just a few weeks, the asset shot above $3.00.
The breakout nearly surpassed all significant moving averages, including the long-term 200-day average, which had limited upside attempts for months. Volume increased significantly during the move, indicating strong market participation rather than a low-liquidity spike.
You Might Also Like

But the rally is starting to show symptoms of overheating. The RSI has risen well into overbought territory above 75, which usually precedes consolidation or profit-taking.
The price is currently trading well above its key moving averages, resulting in a stretched technical setup. That does not imply that the uptrend is over. During significant trend reversals, strong assets frequently stay overbought for extended periods.
However, following such an aggressive advance, traders should be aware that the risk-reward profile becomes less appealing.
The $2.70-$3.00 range is crucial to keep an eye on. If NEAR is able to consolidate above that range, the breakout is maintained and the overall trend remains bullish.
Of the two assets, NEAR has one of the strongest technical structures in the market right now, while ADA remains stuck in a bearish trend with little sign of a long-term reversal.
What to expect?
The market is showing a clear split between weak and strong assets rather than a uniform trend. XRP and ADA both sit in technically damaged positions after losing major support zones and trading below key moving averages. Their charts show persistent seller control, failed recovery attempts, and bearish trend structures that have developed over months rather than days.
While short-term rebounds remain possible because momentum indicators are approaching oversold conditions, neither asset has produced convincing evidence of a sustained reversal. For now, both require recovery of former support levels before their outlook can improve meaningfully.
You Might Also Like

At the same time, ZEC and NEAR demonstrate strong relative strength. Both have significantly outperformed much of the market, remain supported by rising moving averages, and continue to attract buyers despite periods of volatility. However, strength does not eliminate risk. ZEC is consolidating after a large advance, while NEAR has reached overbought conditions following a rapid rally, making pullbacks or sideways periods increasingly likely.
The overall picture is not broadly bullish or broadly bearish; capital appears to be concentrating in a limited number of strong trends while weaker assets continue to lose ground. That is typically a selective market where asset choice matters more than general market direction.

Be the first to comment