



With XRP currently trading perilously close to the psychologically significant $1 level, the asset’s technical structure is still clearly bearish. While buyers have yet to generate a strong reversal signal, XRP has nearly entirely erased the remaining distance between it and this support at about $1.03.
XRP falls short
The issue is shown by the moving-average structure. On the daily chart, XRP trades below each of the major averages. The 50-day moving average is close to $1.08, and the short-term average is around $1.06. The 200-day moving average is still well above price at about $1.37, but more significant resistance can be found at the 100-day average at about $1.18.
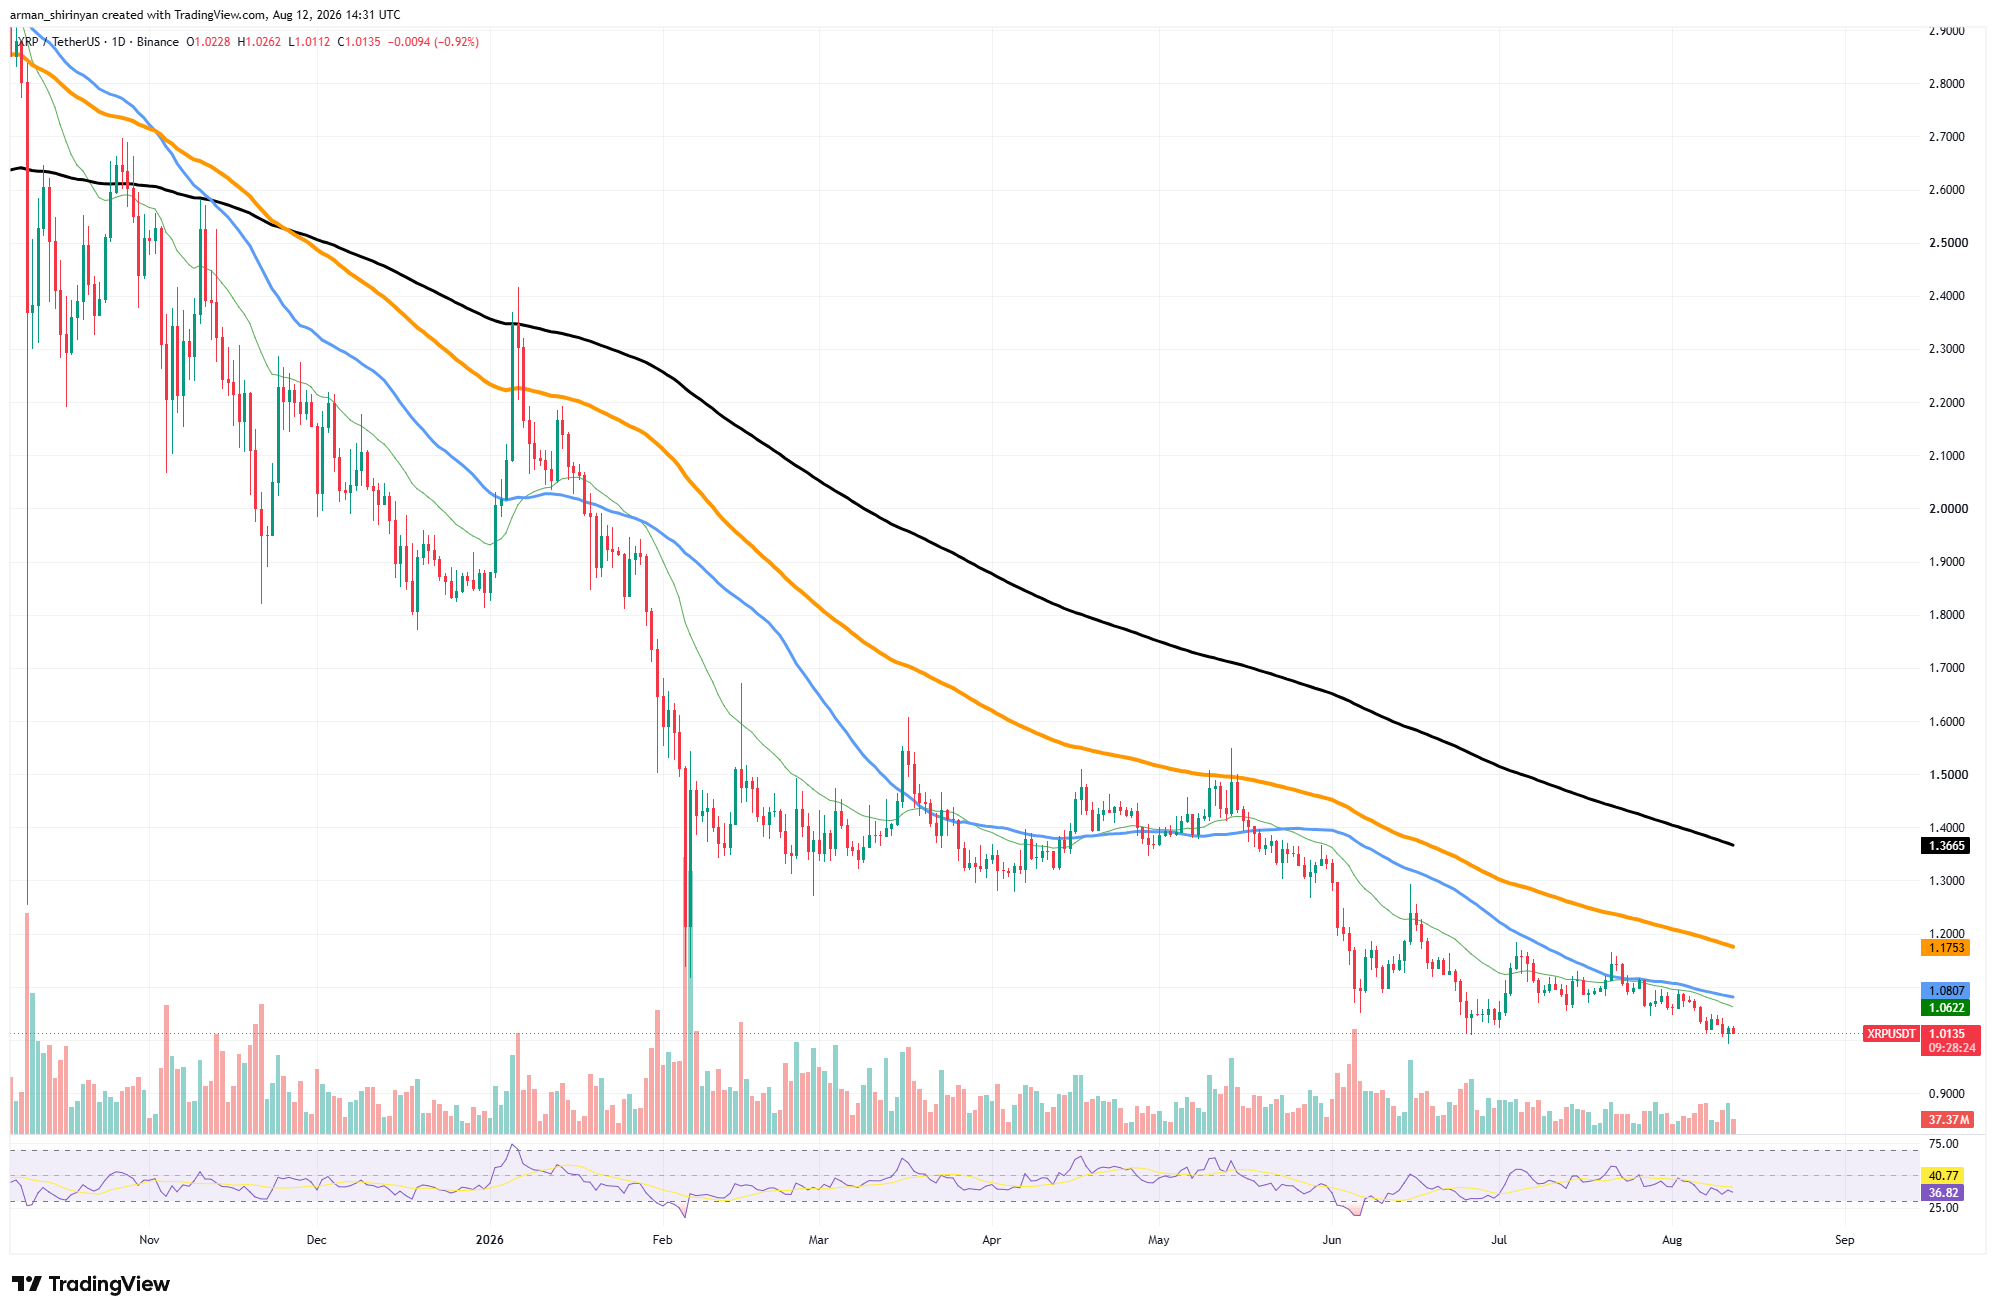
What’s more, every one of these averages is on the decline. As a result, XRP does not just encounter individual resistance levels; rather, it stays within a well-established downtrend where rebounds keep running into progressively lower ceilings. Additionally, momentum is lacking.

The RSI has dropped to about 36.8, getting close to oversold territory without reaching a level that would independently indicate exhaustion. This leaves room for one more downward shift. As a result, the $1 threshold is becoming crucial. A daily breakdown below it could accelerate bearish momentum and eliminate the closest psychological support, especially if it is accompanied by rising volume.
Regaining the $1.06–$1.08 zone would be the first significant improvement needed for XRP to stabilize. Until then, rallies are not indicative of a wider reversal but rather countertrend movements. Sellers continue to benefit from the current structure, and $1 is now the threshold between consolidation and another potentially significant breakdown.
Zcash is gaining ground
Despite another rejection above $500, Zcash’s technical structure remains significantly stronger. At $488, ZEC is currently trading between its short-term moving averages and maintaining the larger bullish structure that was created when the asset recovered from its March lows. The immediate conflict is centered on the $483–$495 range.
ZEC is trading significantly above the 100-day average, which is at $469, and above its 50-day moving average, which is at $483. But the short-term average, which is close to $495, is still above the market, forming resistance nearly precisely at the psychological $500 barrier.
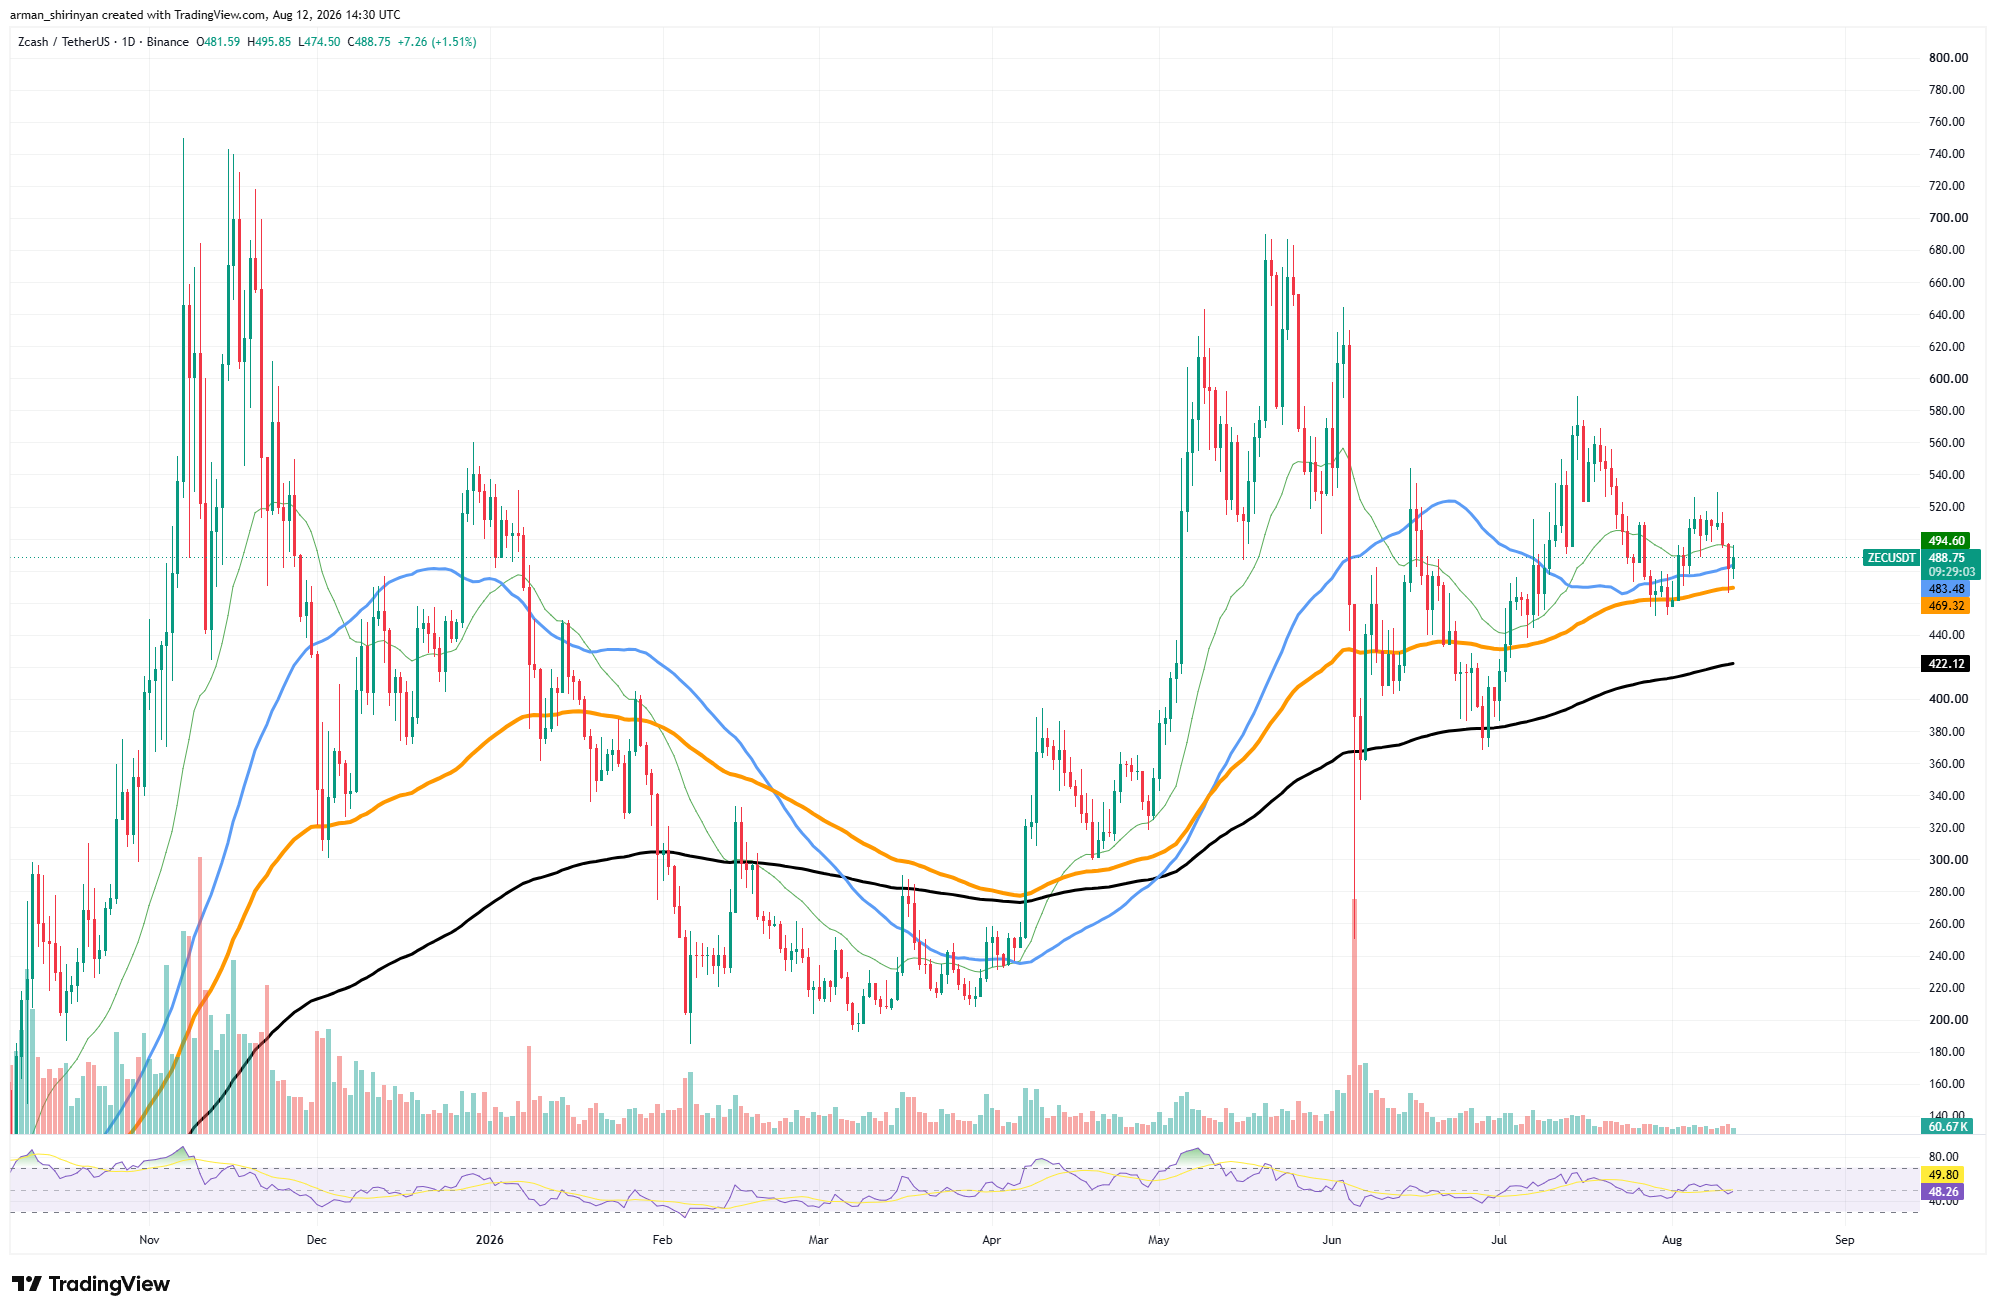
$500 is therefore the most crucial immediate breakout level. In recent weeks, ZEC has made several attempts in this area, but it has had difficulty gaining long-term acceptance above it. The July resistance zone, which is between $560 and $580, would come into play after another successful reclaim, which would expose roughly $520 to $540. The structure on the downside is still comparatively safe.
Through the 50- and 100-day moving averages, the $469–$483 region creates the first notable support cluster. Maintaining the current consolidation would allow for another upside attempt.
More significantly, the 200-day moving average is still rising and sits much lower at about $422. ZEC is still comfortably above its 200-day trend indicator, in contrast to many significant cryptocurrencies that are currently trading below their long-term averages. However, since the explosive moves earlier in the year, volume has significantly decreased. Because of this, a clear breakout above $500 is challenging without increased participation.
As a result, ZEC is still structurally bullish but momentarily range-bound. Buyers maintain control over the larger setup by keeping $469–$483. A decisive $500 reclaim would restore the recent highs, while losing that zone would expose $440 and eventually the 200-day average near $422.
Dogecoin’s decline slows
Although Dogecoin is still in a steep decline, the most recent price movement indicates that selling pressure is starting to lessen. After spending the majority of July and the first part of August consolidating close to its recent lows, DOGE is currently trading around $0.0705. The moving-average structure is still the major issue.
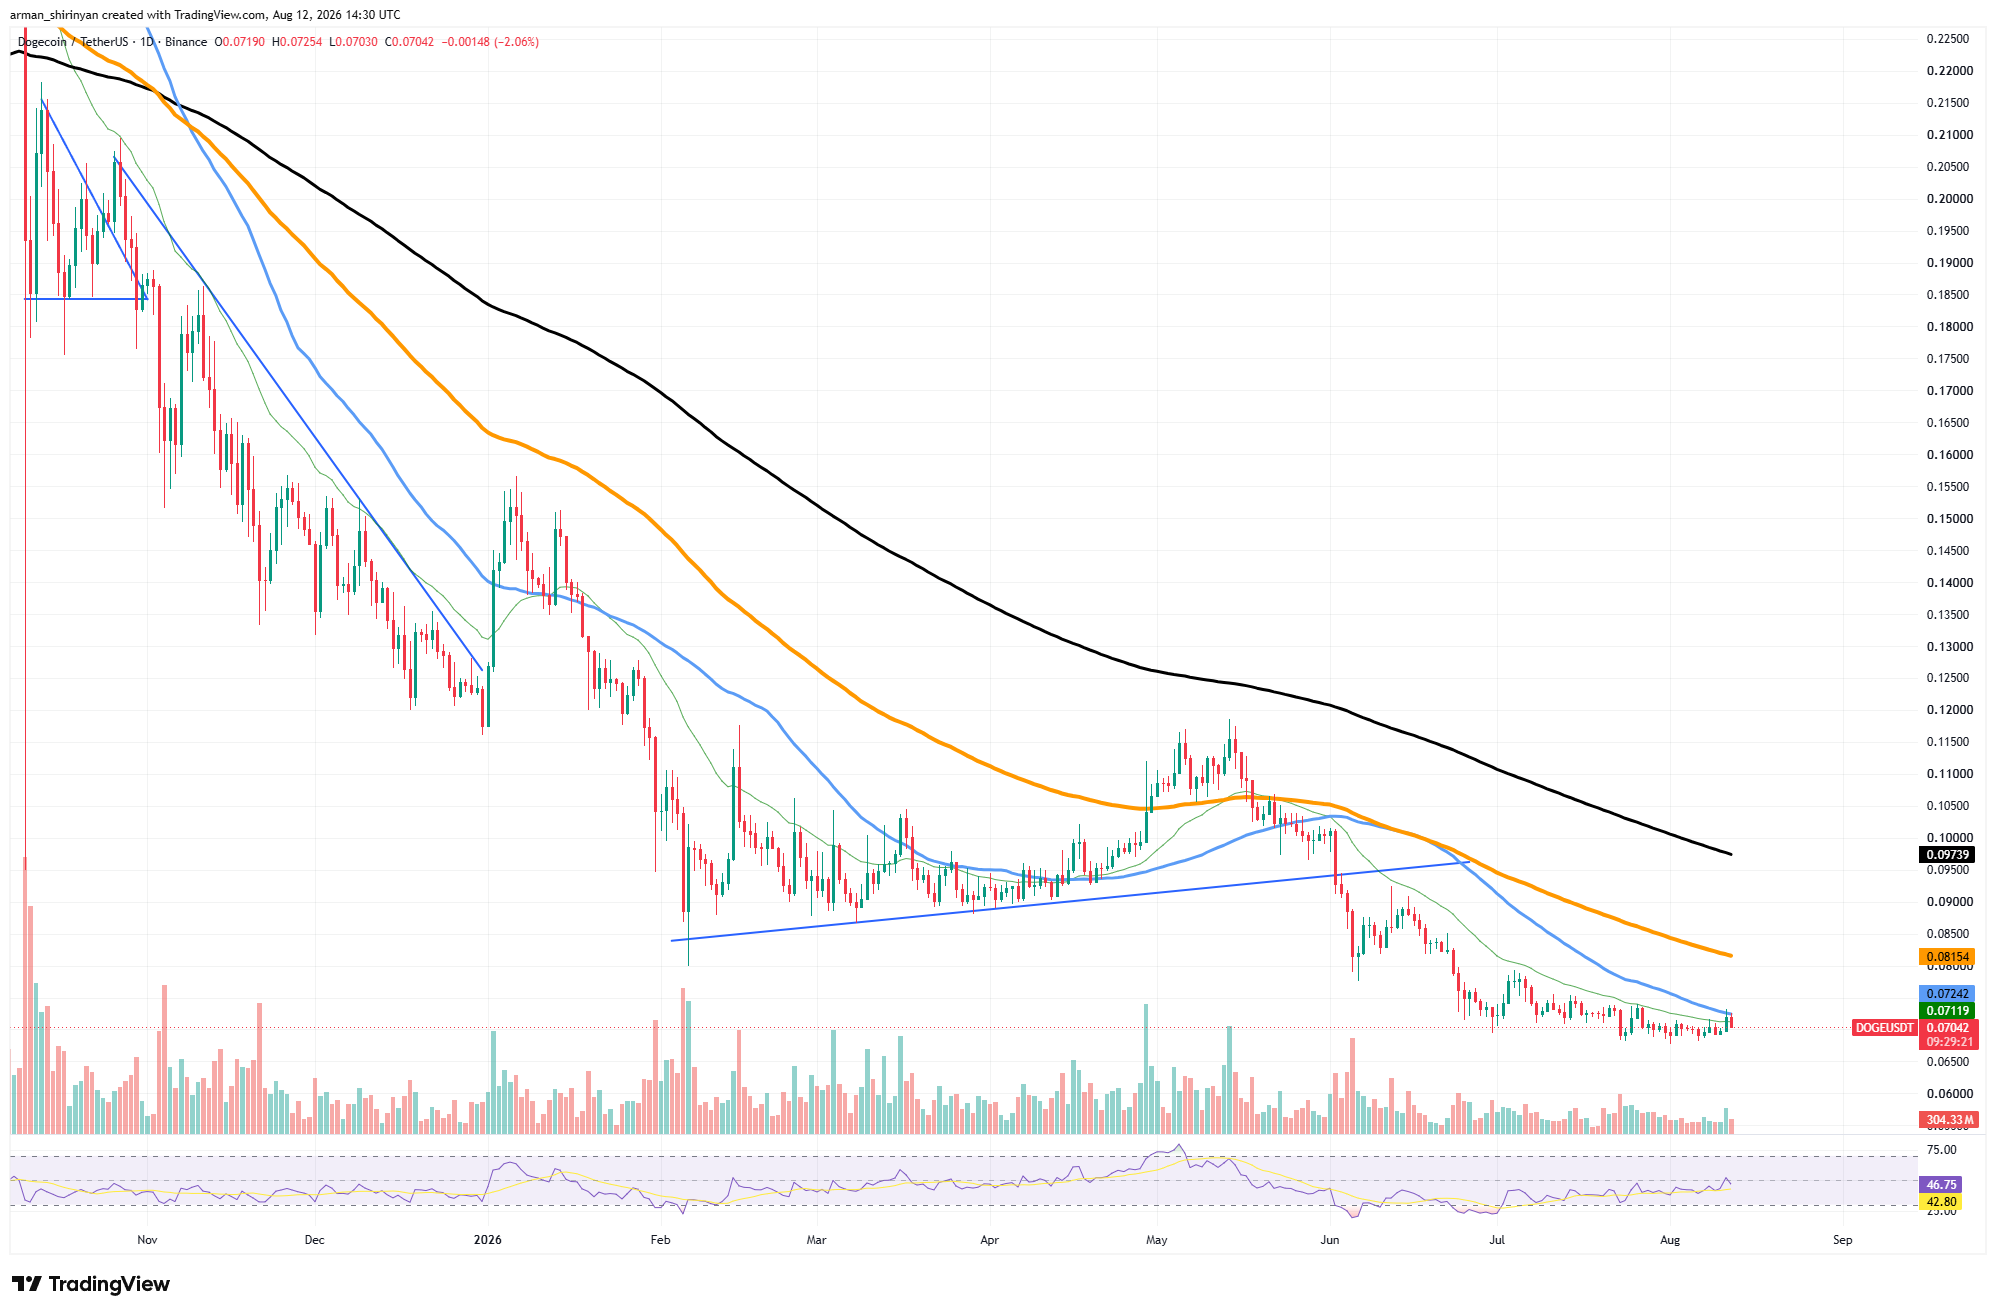
DOGE is trading below the 50-day moving average at $0.0724 and the short-term average at about $0.0712. The 200-day moving average is still far away at $0.0974, while the 100-day moving average at roughly $0.0815 is a much stronger resistance barrier above those levels. As a result, DOGE faces a number of obstacles before a significant trend reversal is feasible.
However, there is some indication that things have stabilized. Instead of continuing the sharp decline observed in June, the price has held around $0.067–$0.070 for a few weeks. Additionally, the RSI has rebounded to about 47, putting momentum in the vicinity of neutral. Therefore, the first bullish objective is rather simple: DOGE must establish support above the short-term moving averages and recover $0.072–$0.073.
A recovery toward $0.08–$0.082 might result from that. The structure continues to be bearish until then. The stabilization attempt would be void and DOGE would be vulnerable to another leg lower if the recent floor around $0.067 were lost. Buyers are beginning to build a foundation, but they still lack control.
Bitcoin stays stuck
Although Bitcoin is still consolidating between $63,600 and $64,000, the market has not yet produced the technical breakout necessary to alter its more general bearish structure. From its June low of about $58,000, Bitcoin has made significant progress, but it has now stalled beneath significant resistance.
The short-term moving averages are at the center of the current conflict. Bitcoin is currently trading around $63,605, which is below the faster average at $64,088 but marginally above the 50-day moving average at $63,337. As a result, there is a narrow compression zone where neither buyers nor sellers can currently exert decisive control.
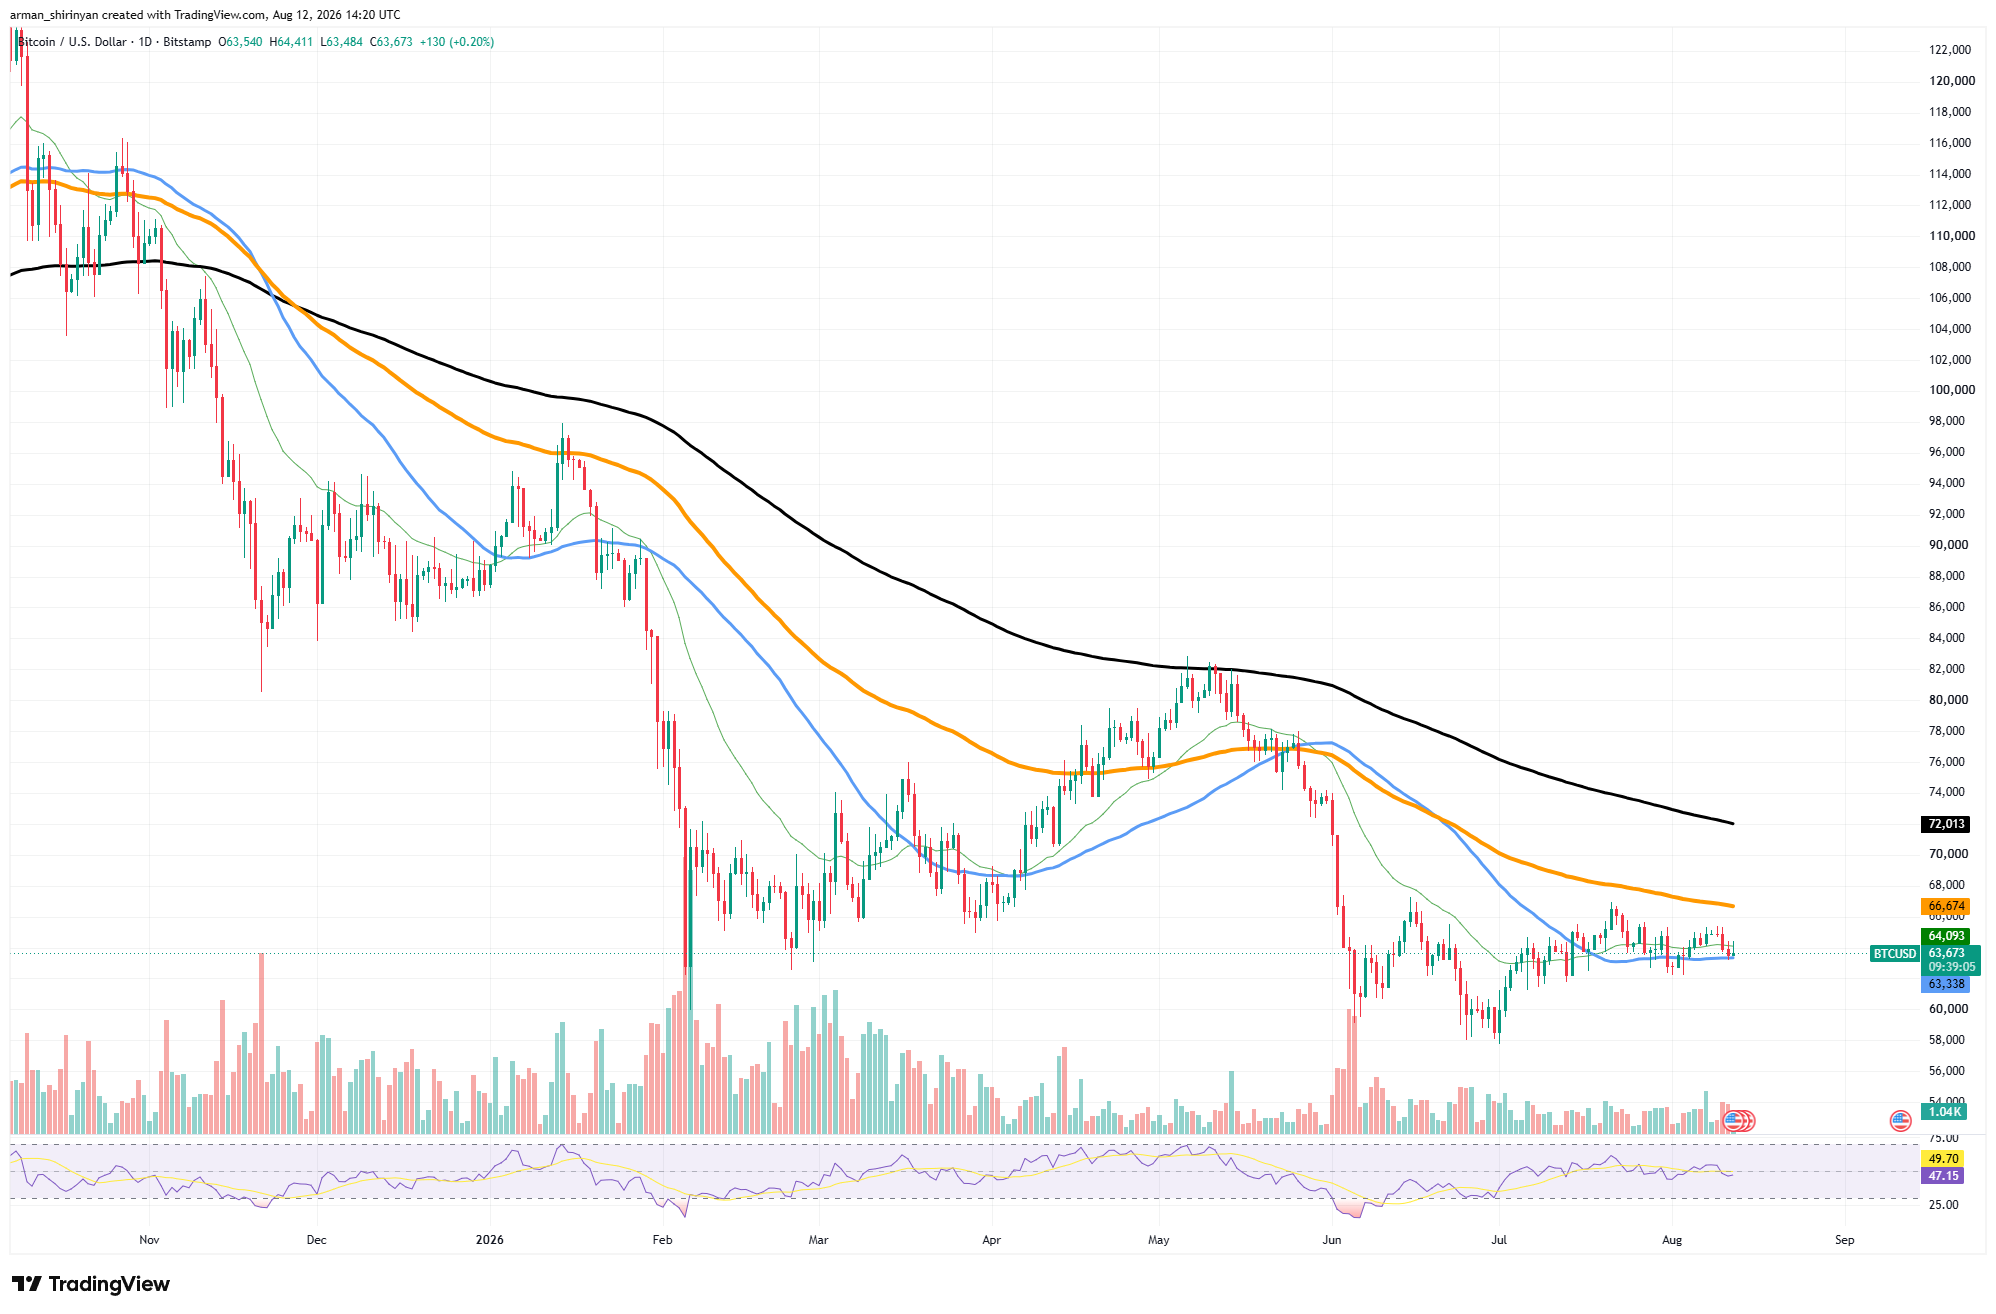
The bigger obstacles are situated much higher. The 200-day moving average is close to $72,012, while the 100-day average is still around $66,673. Both are still sloping downward, with significant overhead pressure. Momentum validates the indecision. Its signal average is close to 49.7, and its RSI is roughly 46.7.
Neither reading suggests a significant bullish acceleration or an oversold market. The positive aspect is that, after recovering from the June sell-off, Bitcoin has consistently defended the $62,000–$63,000 range. Holding this area allows buyers more time to establish a foundation.
The immediate setup would be improved by moving through $64,000–$64,500, but the more important recovery target is still roughly $66,700. $70,000–$72,000 could be put back into play if that level is reclaimed.
On the other hand, losing $62,000 would significantly impair the consolidation and raise the likelihood of another test of $60,000 and ultimately the June lows. Although Bitcoin is stabilizing, its overall trend has not yet reversed.



Be the first to comment