



On its chart, XRP has reached a crucial point where the next move could decide whether the asset eventually stabilizes or continues its wider downtrend. XRP is trying to establish a base close to the $1.08 area following months of intense selling pressure, but the technical picture is still unstable.
XRP’s stabilization is on the line
XRP is trapped inside a narrowing wedge pattern on the daily chart. Squeezed between rising support and falling resistance, the price is currently trading around $1.08. For traders, the upcoming sessions are particularly crucial because these formations usually precede a larger directional move. Bulls should take heart from the fact that XRP is no longer setting aggressive new lows.
Buyers have consistently defended the $1.00–$1.05 zone since the severe sell-off in June. The emergence of higher lows indicates that market demand is progressively rebounding. Resistance is still quite strong, though. XRP is still trading below its exponential moving averages for the next 20, 50, and 100 days, which are around $1.10, $1.14, and $1.25, respectively.

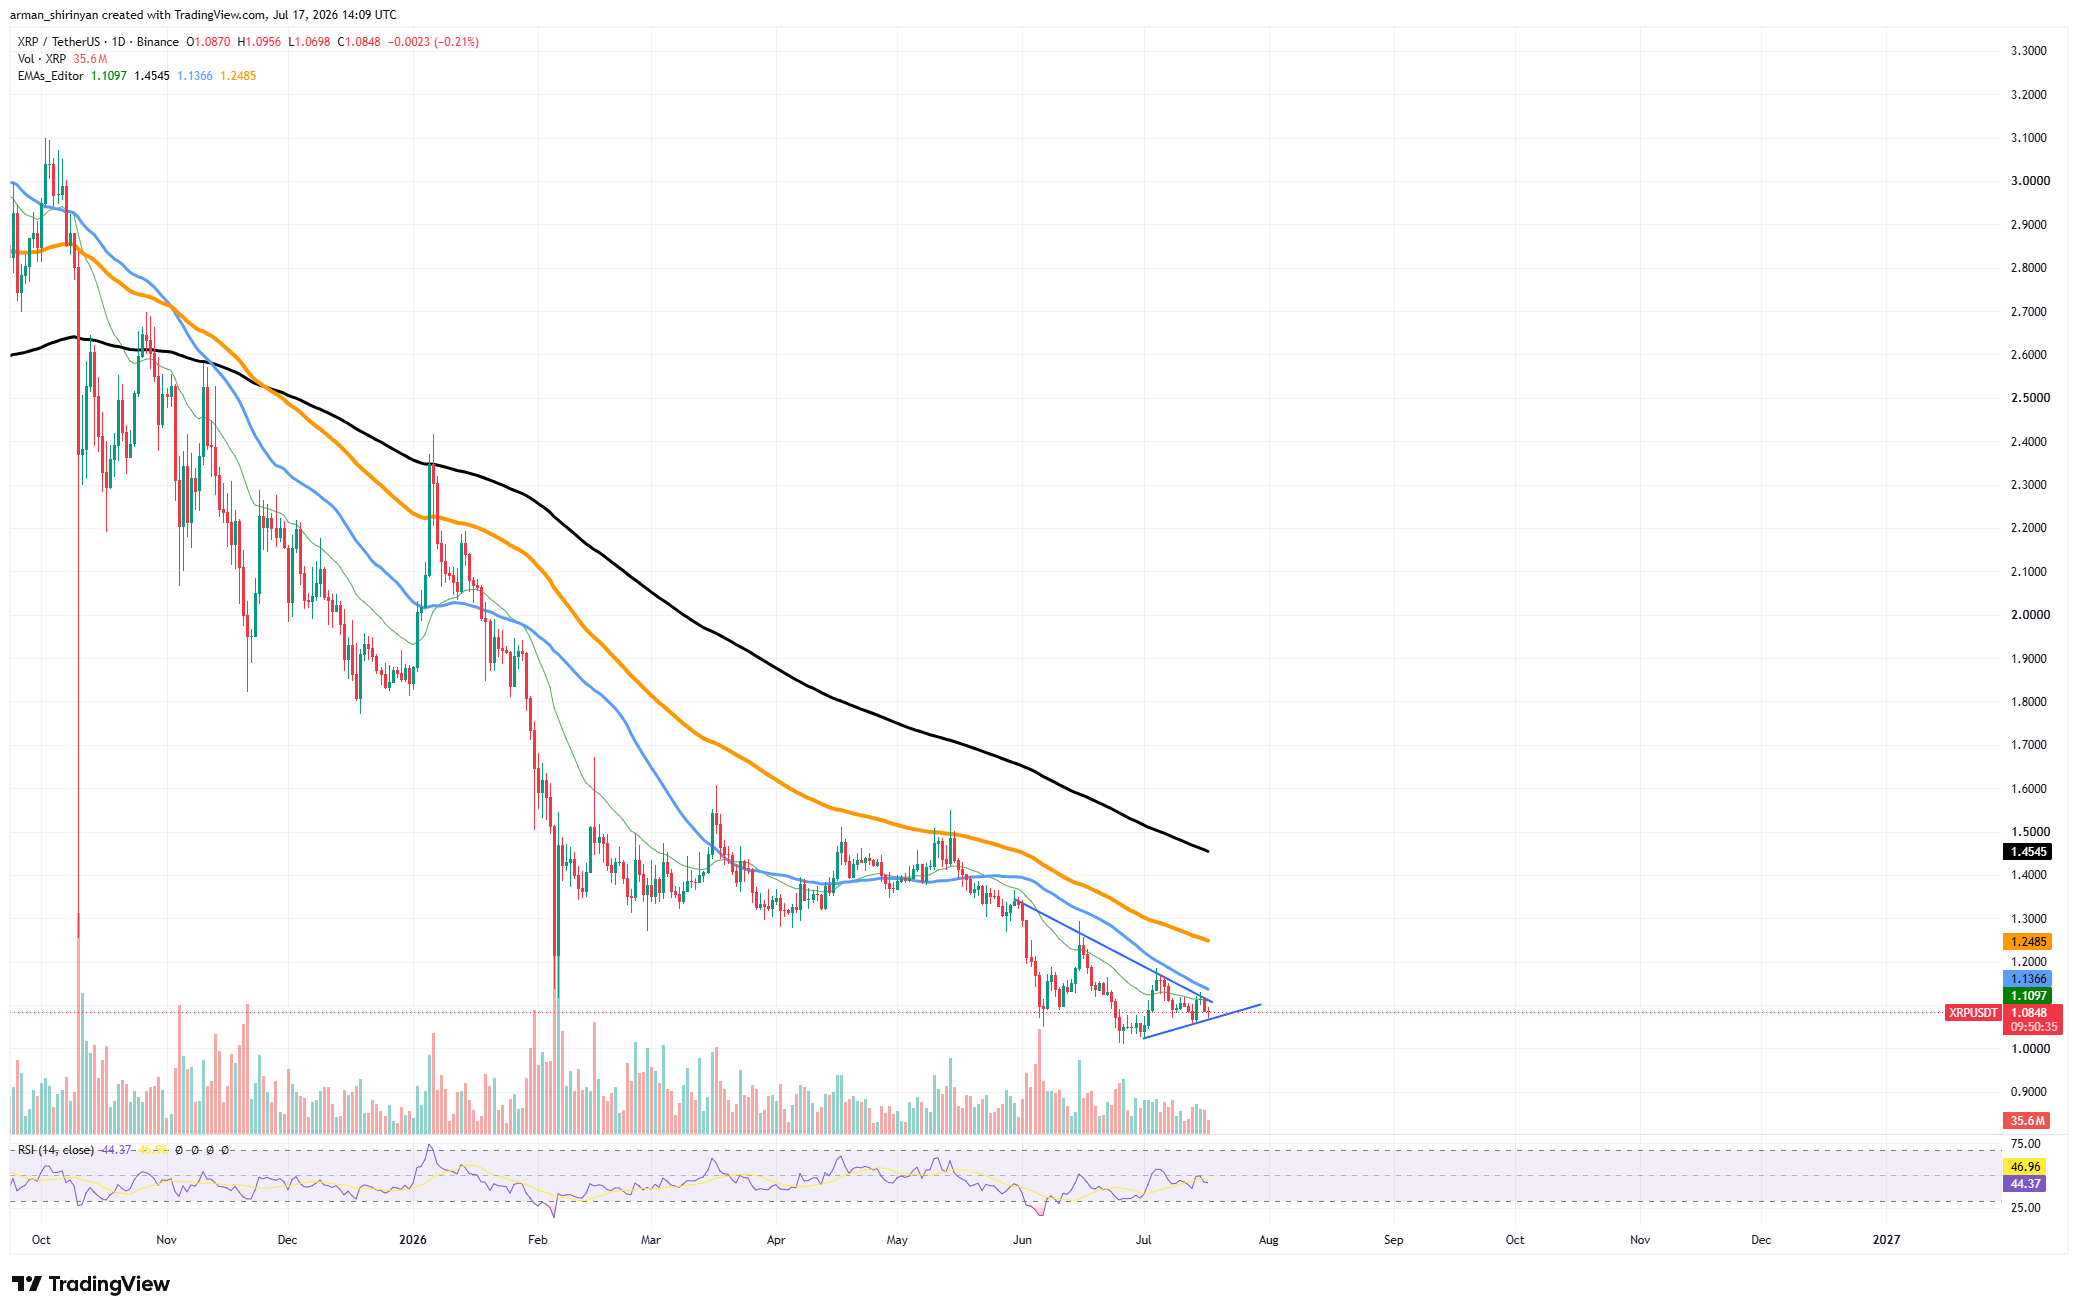
The 200-day EMA, which stands at $1.45 above those levels, is the final barrier separating XRP from a true long-term recovery. Additionally, volume has stayed comparatively low during the consolidation phase. Although buyers have not yet demonstrated enough conviction to force a breakout, sellers are no longer controlling the market as they did earlier in the year.
This lack of involvement frequently leads to unstable conditions where a small amount of selling pressure can cause another decline. The momentum is neutral to bearish, as indicated by the Relative Strength Index, which is currently close to 44. Although the indicator has moved out of oversold territory, it is still below the crucial 50 level, which is frequently associated with more robust bullish trends.
You Might Also Like

The immediate support area for XRP is still around $1.05. A break below that level could lead to a retest of the psychological $1.00 area and invalidate the recent series of higher lows. The asset’s developing structure would be seriously harmed by losing that support. On the upside, a move through $1.10 and a breakout above the declining trendline would be the first indication that bulls are taking back control.
Thus, the stability of XRP’s price is at stake. Although the asset is no longer in free fall, it has not yet demonstrated that a long-term recovery is in progress. The direction of XRP for the rest of the summer may be determined by the next breakout from this narrowing range.
Shiba Inu’s turning point
Shiba Inu is exhibiting the first indications that a possible bottoming process might be under way following months of unrelenting selling pressure. Although a complete trend reversal cannot yet be declared, the most recent chart structure indicates that SHIB may be nearing a significant turning point.
SHIB has been consolidating just above its recent lows for the past few weeks, and it is currently trading close to $0.00000412. In contrast to earlier sell-offs, the token is still in a wider downtrend, but it is no longer making sharp new lows. That shift alone merits consideration.
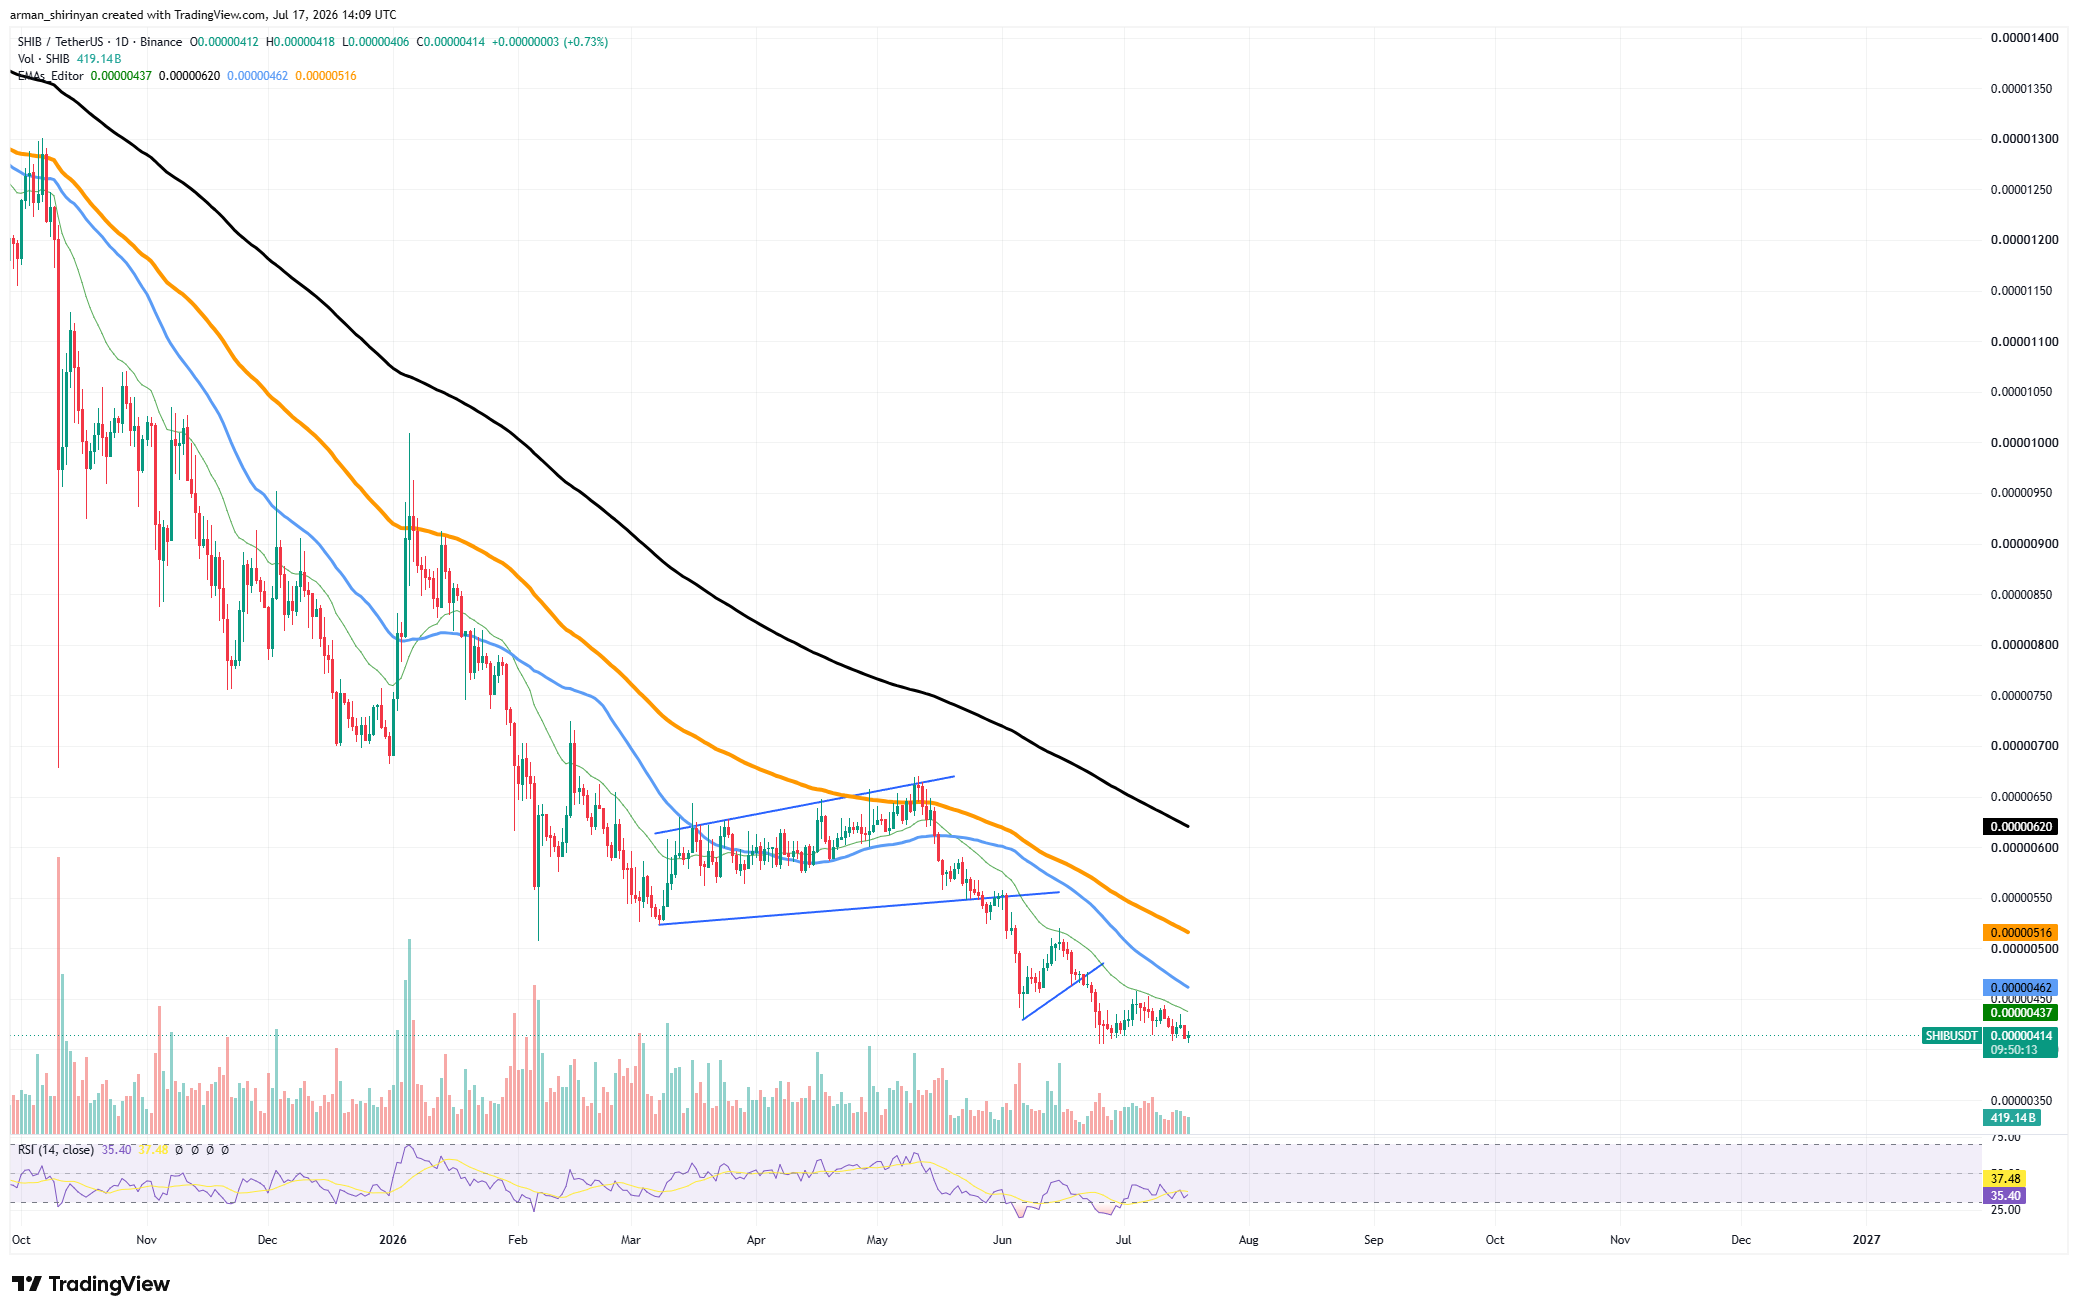
The behavior of momentum is the most significant finding. With a Relative Strength Index close to 34, SHIB is in the vicinity of oversold territory. Long stretches below 40 have historically been linked to seller fatigue. Oversold conditions often precede stabilization phases, but they do not guarantee a reversal.
There is also a slight improvement in price action. Instead of the steep waterfall declines observed earlier in the year, SHIB has experienced a series of comparatively shallow pullbacks since the steep decline in June. Volatility has significantly decreased, which frequently occurs in the vicinity of significant bottoms as both buyers and sellers lose conviction. The technical picture, however, is still far from optimistic.
You Might Also Like

All of the major moving averages are still above SHIB. The 50-day EMA is close to $0.00000446, the 20-day EMA is close to $0.00000437, the 100-day EMA is close to $0.00000516, and the 200-day EMA is close to $0.00000620. Before any significant recovery can be verified, buyers would need to climb this significant resistance ladder. Volume is another concern.
The buying volume has not increased sufficiently to indicate aggressive accumulation, even though selling pressure has decreased. There is currently no discernible increase in demand, which is typically present during true market bottoms.
The most important level to keep an eye on is the current floor at $0.00000400. There is still a chance that a long-term base will form as long as SHIB stays above that region. Much of the stabilization narrative would be refuted by a clear break below it, leaving the token vulnerable to further declines.
Ethereum’s mini-signal
A mini-golden cross is starting to form on the daily chart, indicating one of Ethereum’s most positive technical developments in months. The signal shows increasing momentum and may be an early sign that the market is moving away from the extreme bearish conditions that dominated the first half of the year, even though it is not as significant as a typical 50-day/200-day crossover.
More significantly, what many traders call a ‘mini-golden cross’ was created when the 20-day exponential moving average crossed above the 50-day EMA. This crossover, which indicates that short-term momentum is starting to outperform medium-term price action, frequently occurs in the early phases of more significant trend reversals. In contrast to earlier attempts at recovery, Ethereum has also succeeded in rising above both moving averages. Right now, the 50-day EMA is around $1,740, and the 20-day EMA is close to $1,776.
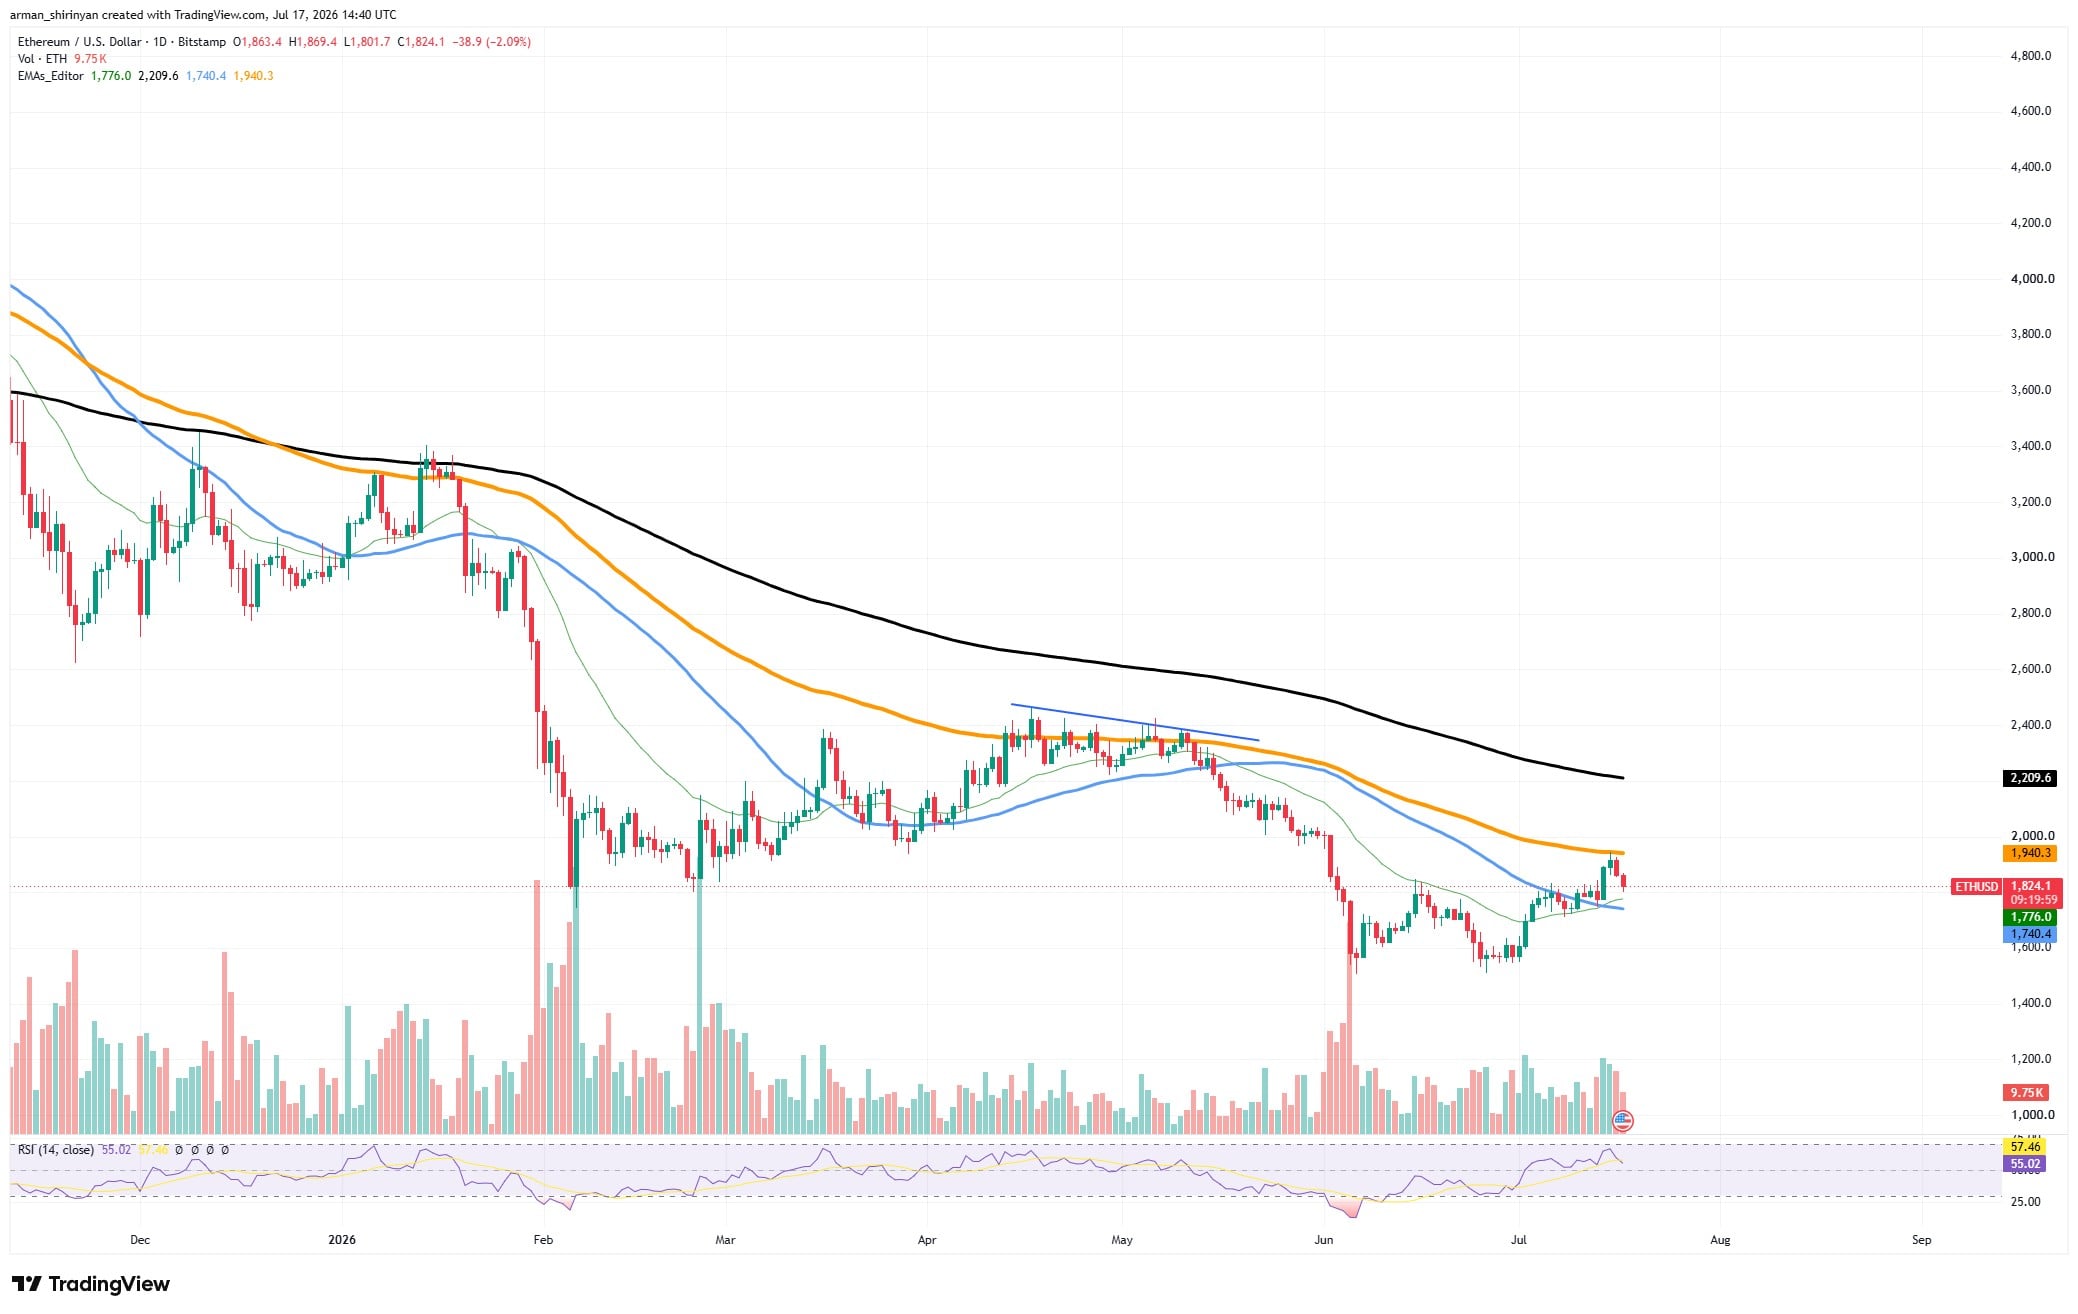
Collectively, they create a zone of support that buyers have successfully maintained throughout July. Bulls are still in danger, though. Ethereum has entered one of the chart’s most significant resistance zones as a direct result of the recent surge. The 200-day EMA is still significantly higher at $2,210, while the 100-day EMA is close to $1,940. Sellers are still active whenever Ethereum approaches significant resistance, as evidenced by the most recent rejection from the $1,900–$1,950 range.
The volume offers some motivation. Increased participation has coincided with the recovery from June’s capitulation low, indicating that real buying demand rather than just short-covering is driving the move. With the Relative Strength Index rising to roughly 55, momentum is firmly in the neutral-to-bullish range.
Ethereum still has room to grow before overheating, in contrast to earlier rallies that swiftly became overextended. Currently, $1,940 is the crucial level to keep an eye on. The bullish case would be greatly strengthened by a breakout above the 100-day EMA, which might pave the way for the psychologically significant $2,000 mark. Additionally, this move would bring the 200-day EMA into focus for the first time in months.



Be the first to comment