



XRP traded near $1.10 at the time of writing, once again testing the rising trendline connecting its higher lows since late June.
Key Takeaways
- XRP defended rising support on July 25.
- Price returned after a weak rebound.
- Binance funding is modestly positive.
- Repeated tests leave the trendline vulnerable.
Price first reached this boundary during the July 25 session, when buyers absorbed enough selling to prevent a confirmed breakdown. The rebound stalled around $1.11, leaving XRP back at the same support only two sessions later.
The triangle remains intact, but the limited response weakens the defence. Buyers have absorbed repeated selling without pushing price decisively away from the boundary, increasing the importance of the next daily close.
Binance Funding Shows a Modest Shift
Positioning on Binance’s perpetual futures market has turned slightly more constructive. According to CryptoQuant’s latest analysis, XRP funding rose to approximately 0.00138 after briefly falling below zero, while its 30-day Z-score reached 0.21.
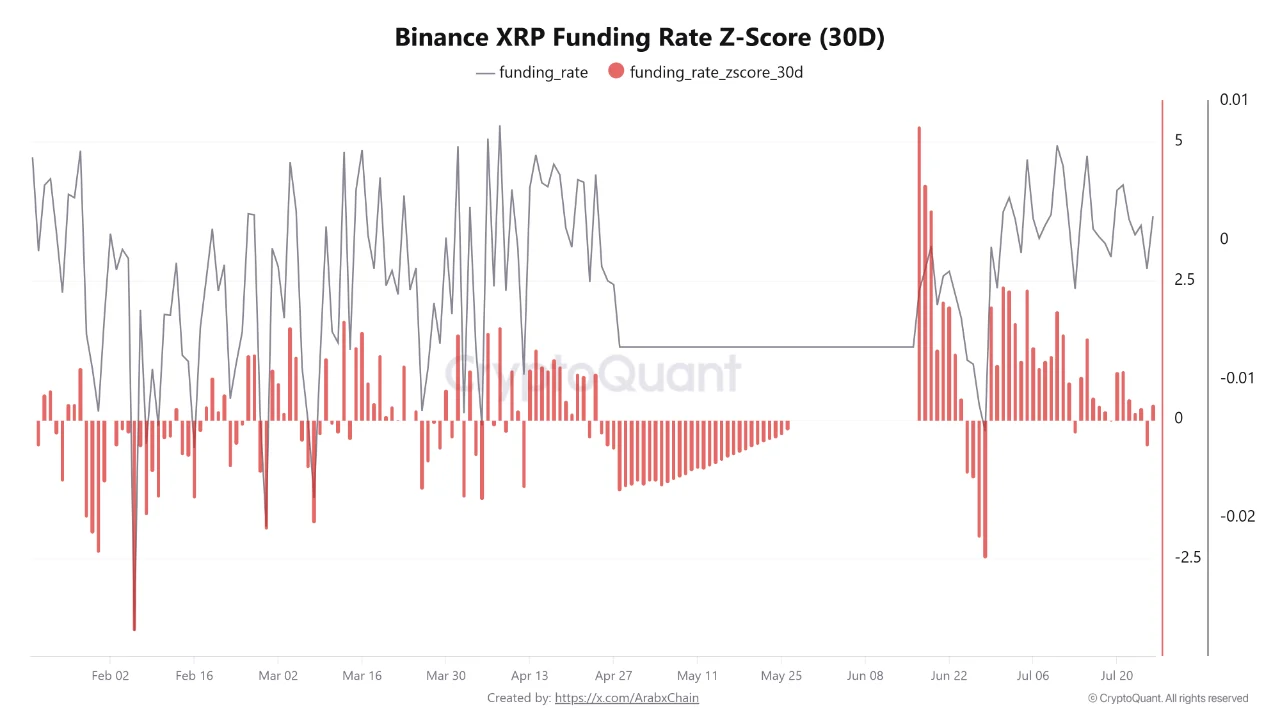
The Z-score places funding only slightly above its recent average. Binance traders are leaning towards longs again, but positioning remains far from an overheated bullish extreme.
This signal is specific to Binance derivatives, while the technical chart reflects Coinbase spot trading. The improvement is consistent with reduced bearish pressure on a major leveraged venue, but it cannot establish that spot demand has strengthened across the wider market.
So far, the shift has coincided with price stabilising at support rather than breaking higher. Broader confirmation would require stronger spot volume and a move through the resistance immediately above XRP.
The Weak Rebound Keeps Buyers Under Pressure
XRP remains below its 50-day simple moving average near $1.11. A daily close above it would create distance from the rising boundary and bring the horizontal resistance around $1.15 back into focus.
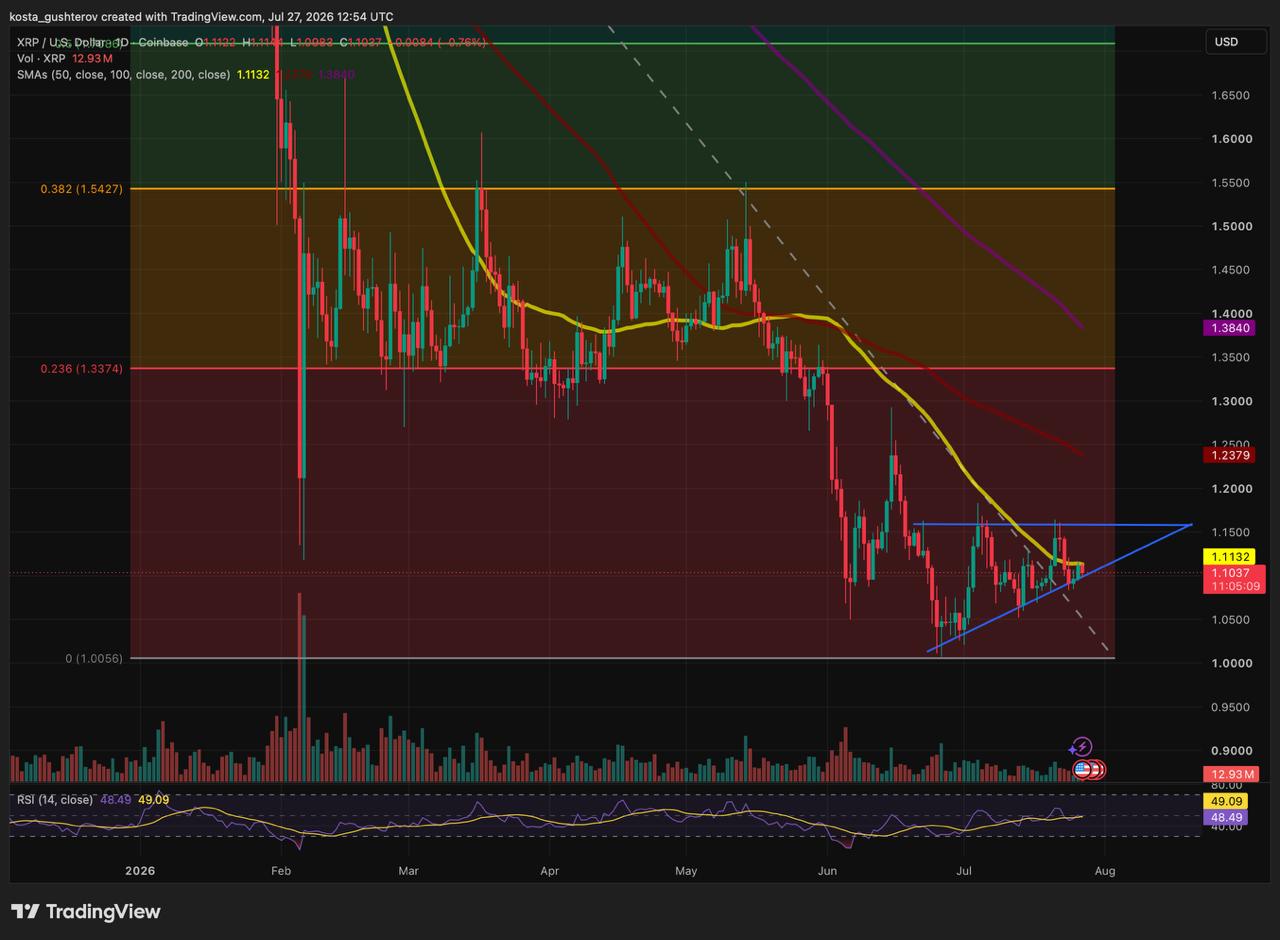
That level has rejected several rallies since late June and forms the upper side of the triangle. A breakout supported by stronger volume would show that demand has moved beyond simply defending the lower trendline.
The broader structure would remain under pressure even then. XRP’s 100-day SMA stands near $1.23, while the 200-day SMA sits around $1.38. Both continue to slope downward and remain well above price.
A Daily Close Below Support Would Expose $1
An intraday move beneath the rising line would carry less weight than a daily close below it. A confirmed loss would interrupt the sequence of higher lows and expose the July low around $1.01, followed by the psychological $1 level.
Binance funding would then help show how leveraged traders respond. A return below zero would indicate renewed demand for short positions. Funding remaining positive during a breakdown could leave recent longs vulnerable if selling accelerates.
The next signals are clear: watch whether XRP reclaims its short-term moving average and whether volume expands during another test of $1.15. Another weak bounce from the trendline would leave support increasingly exposed, while a close below it would shift the immediate focus back to $1.
- Disclaimer: This article is for informational and analytical purposes only and does not constitute financial or investment advice. Technical patterns and derivatives indicators do not guarantee future price movements.
- Methodology: Technical levels are based on the supplied daily XRP/USD Coinbase chart dated July 27, 2026. Funding and Z-score data are specific to Binance perpetual futures and come from the linked CryptoQuant analysis.

Kosta has reported on cryptocurrency markets and blockchain infrastructure since 2020, bringing over six years of hands-on experience in the crypto industry built through daily tracking of markets, trends, and emerging blockchain developments. Specializing in Bitcoin on-chain analysis, institutional ETF flows, and digital asset price action, his work at Coindoo has been cited by other news agencies and consistently covers market developments with a focus on data-driven reporting across Bitcoin, Ethereum, Solana, and XRP.
Over the years, Kosta has contributed to multiple crypto media outlets in different regions, authoring over 6,000 articles across the sector. His reporting spans cryptocurrency markets and the broader fintech industry, tracking not only price action but also the technological and regulatory forces shaping the ecosystem.
To support his analysis, Kosta actively leverages on-chain data and metrics from leading platforms such as Santiment, Glassnode, and CryptoQuant, enabling deeper, evidence-based market insights. He believes in the power of transparency and the data that underpins the blockchain ecosystem.
His academic background in Marketing Management from Denmark further complements his analytical approach, adding a strong understanding of communication strategy and content positioning to his work.


Be the first to comment