


Zcash fell through the support cluster at $470 and $472 little after activating Ironwood, the network’s most consequential upgrade in years, trading near $461 at the time of writing
Key Takeaways
- Ironwood closes a supply-verification gap.
- Spot and futures flows remain negative.
- The nearest support sits at $450.
- Losing $450 would expose $419.
The Flaw Ironwood Was Built to Close
Developers found a soundness flaw in the zero-knowledge circuit behind Orchard, Zcash’s shielded pool. In theory it allowed counterfeit ZEC to be created without detection. The patch shipped in June, and no evidence of exploitation surfaced.
Proving that turned out to be the harder problem. Orchard’s privacy guarantees, the reason the pool exists, also made its recorded supply impossible for users to audit independently. A shielded pool that nobody can inspect cannot demonstrate that nobody exploited it.
Ironwood answers that by introducing a new shielded pool and version 6 transactions while closing Orchard to new deposits. Funds leaving the old pool pass through a turnstile that caps outflows at the total that previously went in. As balances migrate, the supply becomes verifiable.
This is real engineering work on a real problem. It creates no reason for anyone to buy the token today.
The Market Had Already Moved On
ZEC climbed towards $560 earlier in July, then began printing lower highs and lower lows. By activation day on July 28 the token was trading inside a falling channel and approaching the $470 cluster from above.
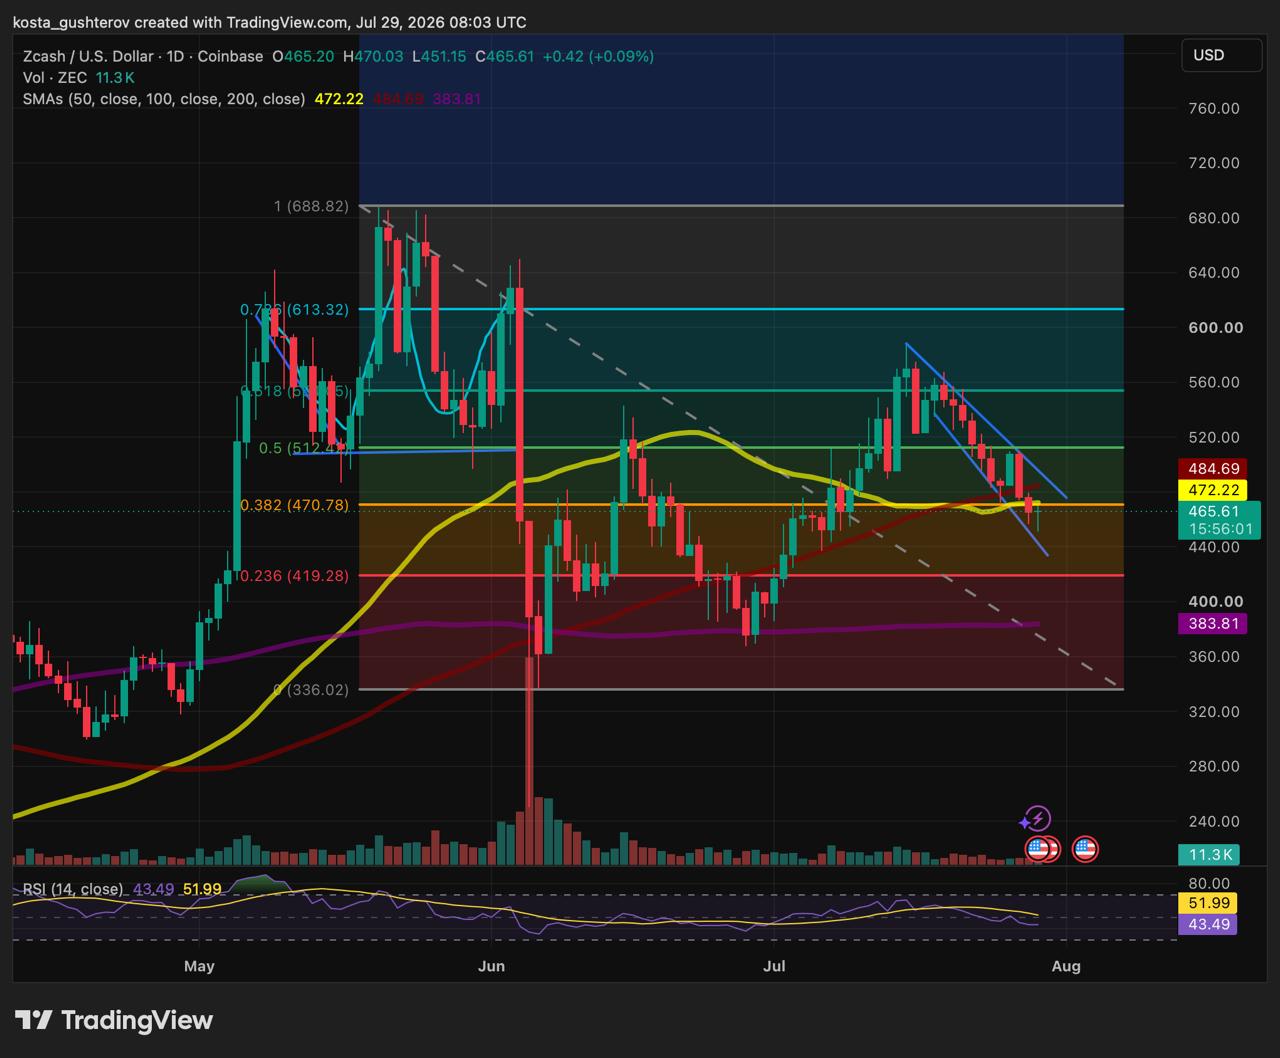
That sequence could be the whole explanation. Ironwood was announced, documented and discussed for weeks, giving anyone who wanted exposure ample time to take it. Traders holding into the event had their catalyst; those arriving afterwards found a chart that had already turned.
Price action cannot identify individual sellers or their motives. What it establishes is that a successful upgrade landed without generating enough demand to interrupt a decline already underway.
Flow Data Points the Same Way
Coinglass recorded net negative spot flows across every window on its dashboard. The 12-hour balance showed $10.2 million in and $12.81 million out, for a net of minus $2.6 million. Eight hours ran to minus $1.65 million, four hours to minus $935,000, and the most recent hour to minus $329,000 on $1.18 million in against $1.5 million out.
Futures told a similar story at the longer horizons: $148.5 million in against $155.6 million out over 12 hours, a net of minus $7.1 million, with eight hours at minus $2.98 million. The shorter windows flipped positive, adding $418,000 over four hours and $213,000 over one.
Those late positive readings show derivatives traders returning around current prices. Their direction is unknowable from flow balances alone, and their size leaves the 12-hour imbalance untouched.
One caveat applies throughout. These are Coinglass flow balances, and the dashboard does not define whether each movement represents an exchange transfer, a completed trade or another accounting category. They indicate direction, not executed buying and selling.
Where the Levels Sit Now
The 0.382 Fibonacci retracement near $470 and the 50-day moving average at $472 sat close enough together to function as a single support zone. ZEC now trades beneath both, which converts the area into resistance: traders who bought there may sell a rebound to exit nearer break-even, while others treat it as a fresh entry for shorts.
Today’s high of $470 stopped just next to the Fibonacci level. A daily close above $472 would reclaim both, and the 100-day average at $484 sits immediately beyond, making three technical hurdles inside $14.
Below, $450 is the first support, an area that absorbed trading recently and sits near the falling channel’s lower boundary. A close beneath it opens the 0.236 retracement around $420, which shaped price through the May and June swings.
Verified Scarcity Still Needs a Buyer
Ironwood arrived weeks after more than 80% of all ZEC entered circulation. As covered in our analysis of Zcash’s 80% supply milestone, future issuance now represents a shrinking share of maximum supply, which steadily reduces dilution from mining.
The two developments reinforce each other. Less new issuance tightens the supply picture, and Ironwood lets the market confirm that migration from Orchard adds nothing beyond what the turnstile permits.
Scarcity works on the supply side of the equation. The demand side is what the flow data measures, and it has yet to respond. Zcash spent this month fixing what it could control and discovering that the market was looking elsewhere.
- Disclaimer: This article is for informational purposes only and does not constitute financial or investment advice. Network upgrades, technical indicators and flow data do not guarantee future price performance.
- Methodology: The analysis uses the ZEC/USD daily chart dated July 29, 2026, Fibonacci retracements, moving averages, RSI and Coinglass Spot Flows and Futures Flows dashboards. Because the dashboards do not define the accounting methodology behind each flow category, the figures are presented as directional net-flow balances rather than direct evidence of buying, selling or exchange inventory changes.

Kosta has reported on cryptocurrency markets and blockchain infrastructure since 2020, bringing over six years of hands-on experience in the crypto industry built through daily tracking of markets, trends, and emerging blockchain developments. Specializing in Bitcoin on-chain analysis, institutional ETF flows, and digital asset price action, his work at Coindoo has been cited by other news agencies and consistently covers market developments with a focus on data-driven reporting across Bitcoin, Ethereum, Solana, and XRP.
Over the years, Kosta has contributed to multiple crypto media outlets in different regions, authoring over 6,000 articles across the sector. His reporting spans cryptocurrency markets and the broader fintech industry, tracking not only price action but also the technological and regulatory forces shaping the ecosystem.
To support his analysis, Kosta actively leverages on-chain data and metrics from leading platforms such as Santiment, Glassnode, and CryptoQuant, enabling deeper, evidence-based market insights. He believes in the power of transparency and the data that underpins the blockchain ecosystem.
His academic background in Marketing Management from Denmark further complements his analytical approach, adding a strong understanding of communication strategy and content positioning to his work.



Be the first to comment